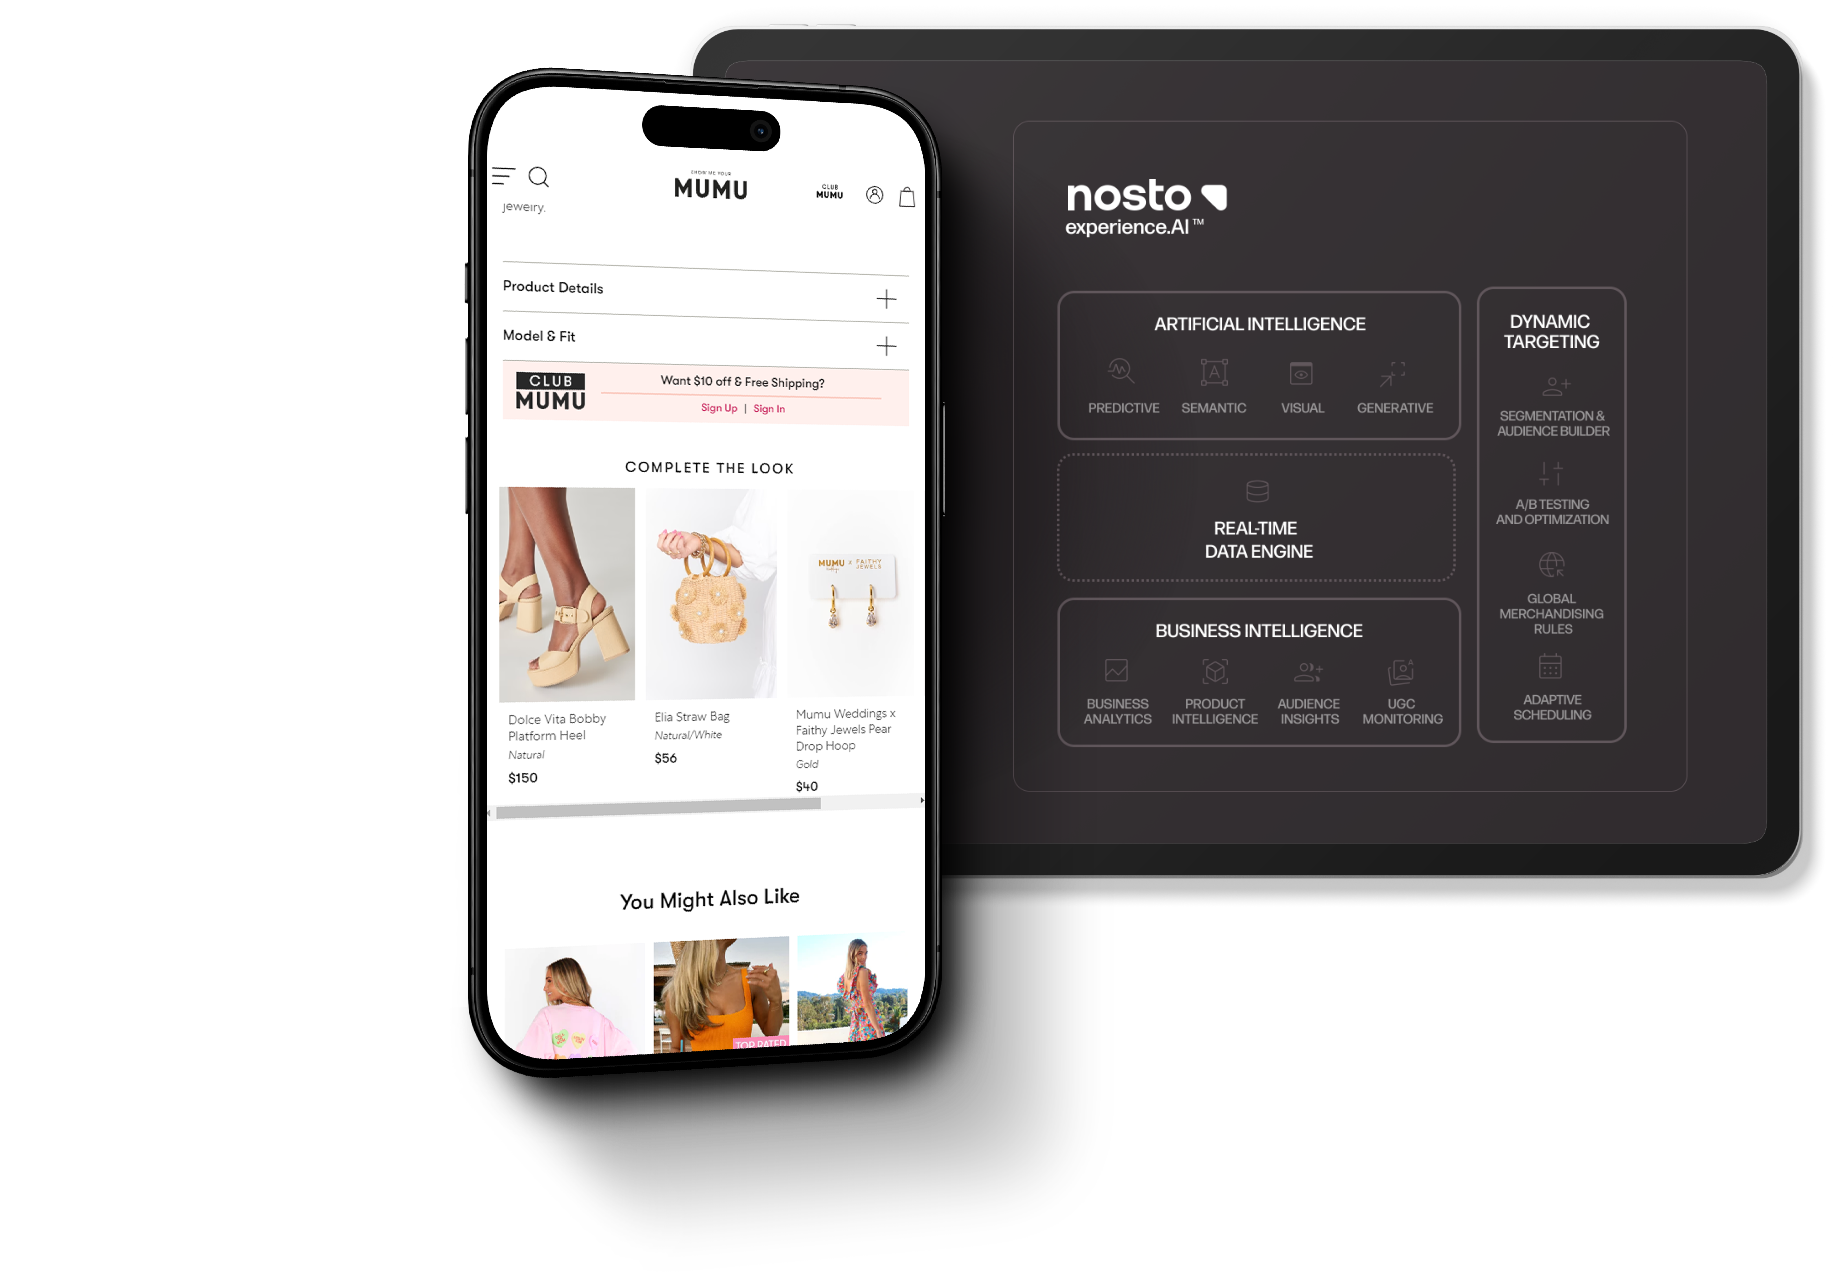
Ecommerce Statistics in 2021 Every Retailer Needs to Know

To help retailers get a better grasp on the current state of ecommerce (and how to prepare for it), we took a look at global performance, industry leaders and mobile usage to uncover opportunities to grow. Here's a roundup of the top ecommerce statistics every retailer should act on in 2021.

Heading into 2021, the retail industry looks wildly different from what it was just a year ago.

Thanks to 2020, millions of retailers now depend on ecommerce as their sole channel for revenue. Those that are able to continue brick-and-mortar operations are looking for ways to build trust and the promise of safety with consumers. Add to that an extremely tight competition for digital real estate and now ecommerce suddenly feels like a dragon that many brands are still learning how to slay.

But despite these changes, one thing remains true: there is a way forward.

To help retailers get a better grasp on the current state of ecommerce (and how to prepare for it), we took a look at global performance, industry leaders and mobile usage to uncover opportunities to grow. Here’s a roundup of the top ecommerce statistics every retailer should act on in 2021.

Global Ecommerce Sales (2020-2021)

Ecommerce Business Statistics: Companies Leading the Market

The chart below illustrates leading vertical ecommerce companies – most of which are split between the US, UK and Germany (with some performance from brands across Poland, France and Australia).

Peloton (a home workout cycling retailer), Wayfair (a homegoods retailer) and Ocado (a British online supermarket) lead the way in terms of market share. This is in line with pandemic lockdown trends as many people turned to at-home exercises, DIY home and garden projects and virtual grocery shopping in order to adhere to social distancing measures.

Consumer survey: Home and garden retail goes virtual

In 2020, more people spending time in their homes meant higher traffic and sales for home and garden retailers. Our home and garden consumer survey analyzes shopper affinities during 2020 and opportunities for Home and Garden retailers.

UK Ecommerce Statistics: What are Consumers Buying?

If we look at consumer behavior in the UK throughout, fashion and accessories holds the number one spot (55%) in terms of goods purchased. Food deliveries come in second (32%) — a not-so-surprising result of indoor restaurant dining due to the COVID-19 pandemic.

Interested in seeing more ecommerce statistics by vertical?

Nosto’s State of Ecommerce Q3 2020 breaks down the trends in key performance indicators seen in the industry across 6 different verticals during May-August 2020.

Mobile Commerce Statistics

As the demand for ecommerce continues to rise, so does the desire for mobile experiences. Data shows that mobile is projected to account for 72.9% of total ecommerce sales:

What does this mean for retailers?

Despite consumers being less ‘on the go’ than past years, the demand for mobile-friendly experiences is still strong. This increases the need for retailers to focus on:

  • Offering personalized site experiences with limited screen real estate
  • Implementing a mobile-friendly UX
  • Facilitating seamless route to checkout

Statistics and Best Practices Based on Key Site Experience Factors

To help ecommerce retailers hit the ground running in 2021, we’ve compiled the ultimate roundup of industry trends and best practices: from choosing the right ecommerce platform to driving conversion rate, lowering return rate and optimizing experiences such as site search, shipping and delivery and fraud management.

Ecommerce statistics based on key focus areas:

  • Platforms
  • Personalization
  • Site search
  • Conversion rate
  • Cart abandonment
  • Email marketing
  • Return rate
  • Shipping and returns
  • Fraud