Measuring the Success of Your User-Generated Content Strategy
What does marketing success look like? It’s a simple (yet important) question with an answer that’s often more complex than you’d think.
Although goal-setting is a standard step in building any marketing strategy or campaign, the goals teams tend to focus on are frequently vague and lack specific key performance indicators (KPIs) that are properly documented, benchmarked and tracked.
As the saying goes, if you don’t measure it, you can’t improve it.
To help you properly measure the success for your user-generated content (UGC) strategies and campaigns, we’ve built the UGC KPI Matrix.
First, there are two standard types of metrics marketers should understand and always be tracking: production metrics and performance metrics.
Content Production Metrics
Production metrics help monitor ongoing processes, costs and productivity. While you might not always have targeted goals around improving your overall productivity and efficiency, these are critical KPIs to continually track over time.
Content production KPIs include metrics like:
- Content costs
- Time to publish
- Amount of content published per day/week/month/quarter/etc.
Content Performance Metrics
Performance metrics are typically more closely tied to the specific goal, piece of content or the distribution channels you’re leveraging in your campaign or overall strategy. Where teams often get tripped up is that they tend to set broad goals — like to grow awareness or increase engagement — but then fail to actively track relevant hard metrics that would show progress towards that goal.
Performance KPIs include metrics like:
- Ad impressions
- Average time on page
- Pages/visit
- Email subscriptions
- Click-through rates
- Conversion rates
- Revenue
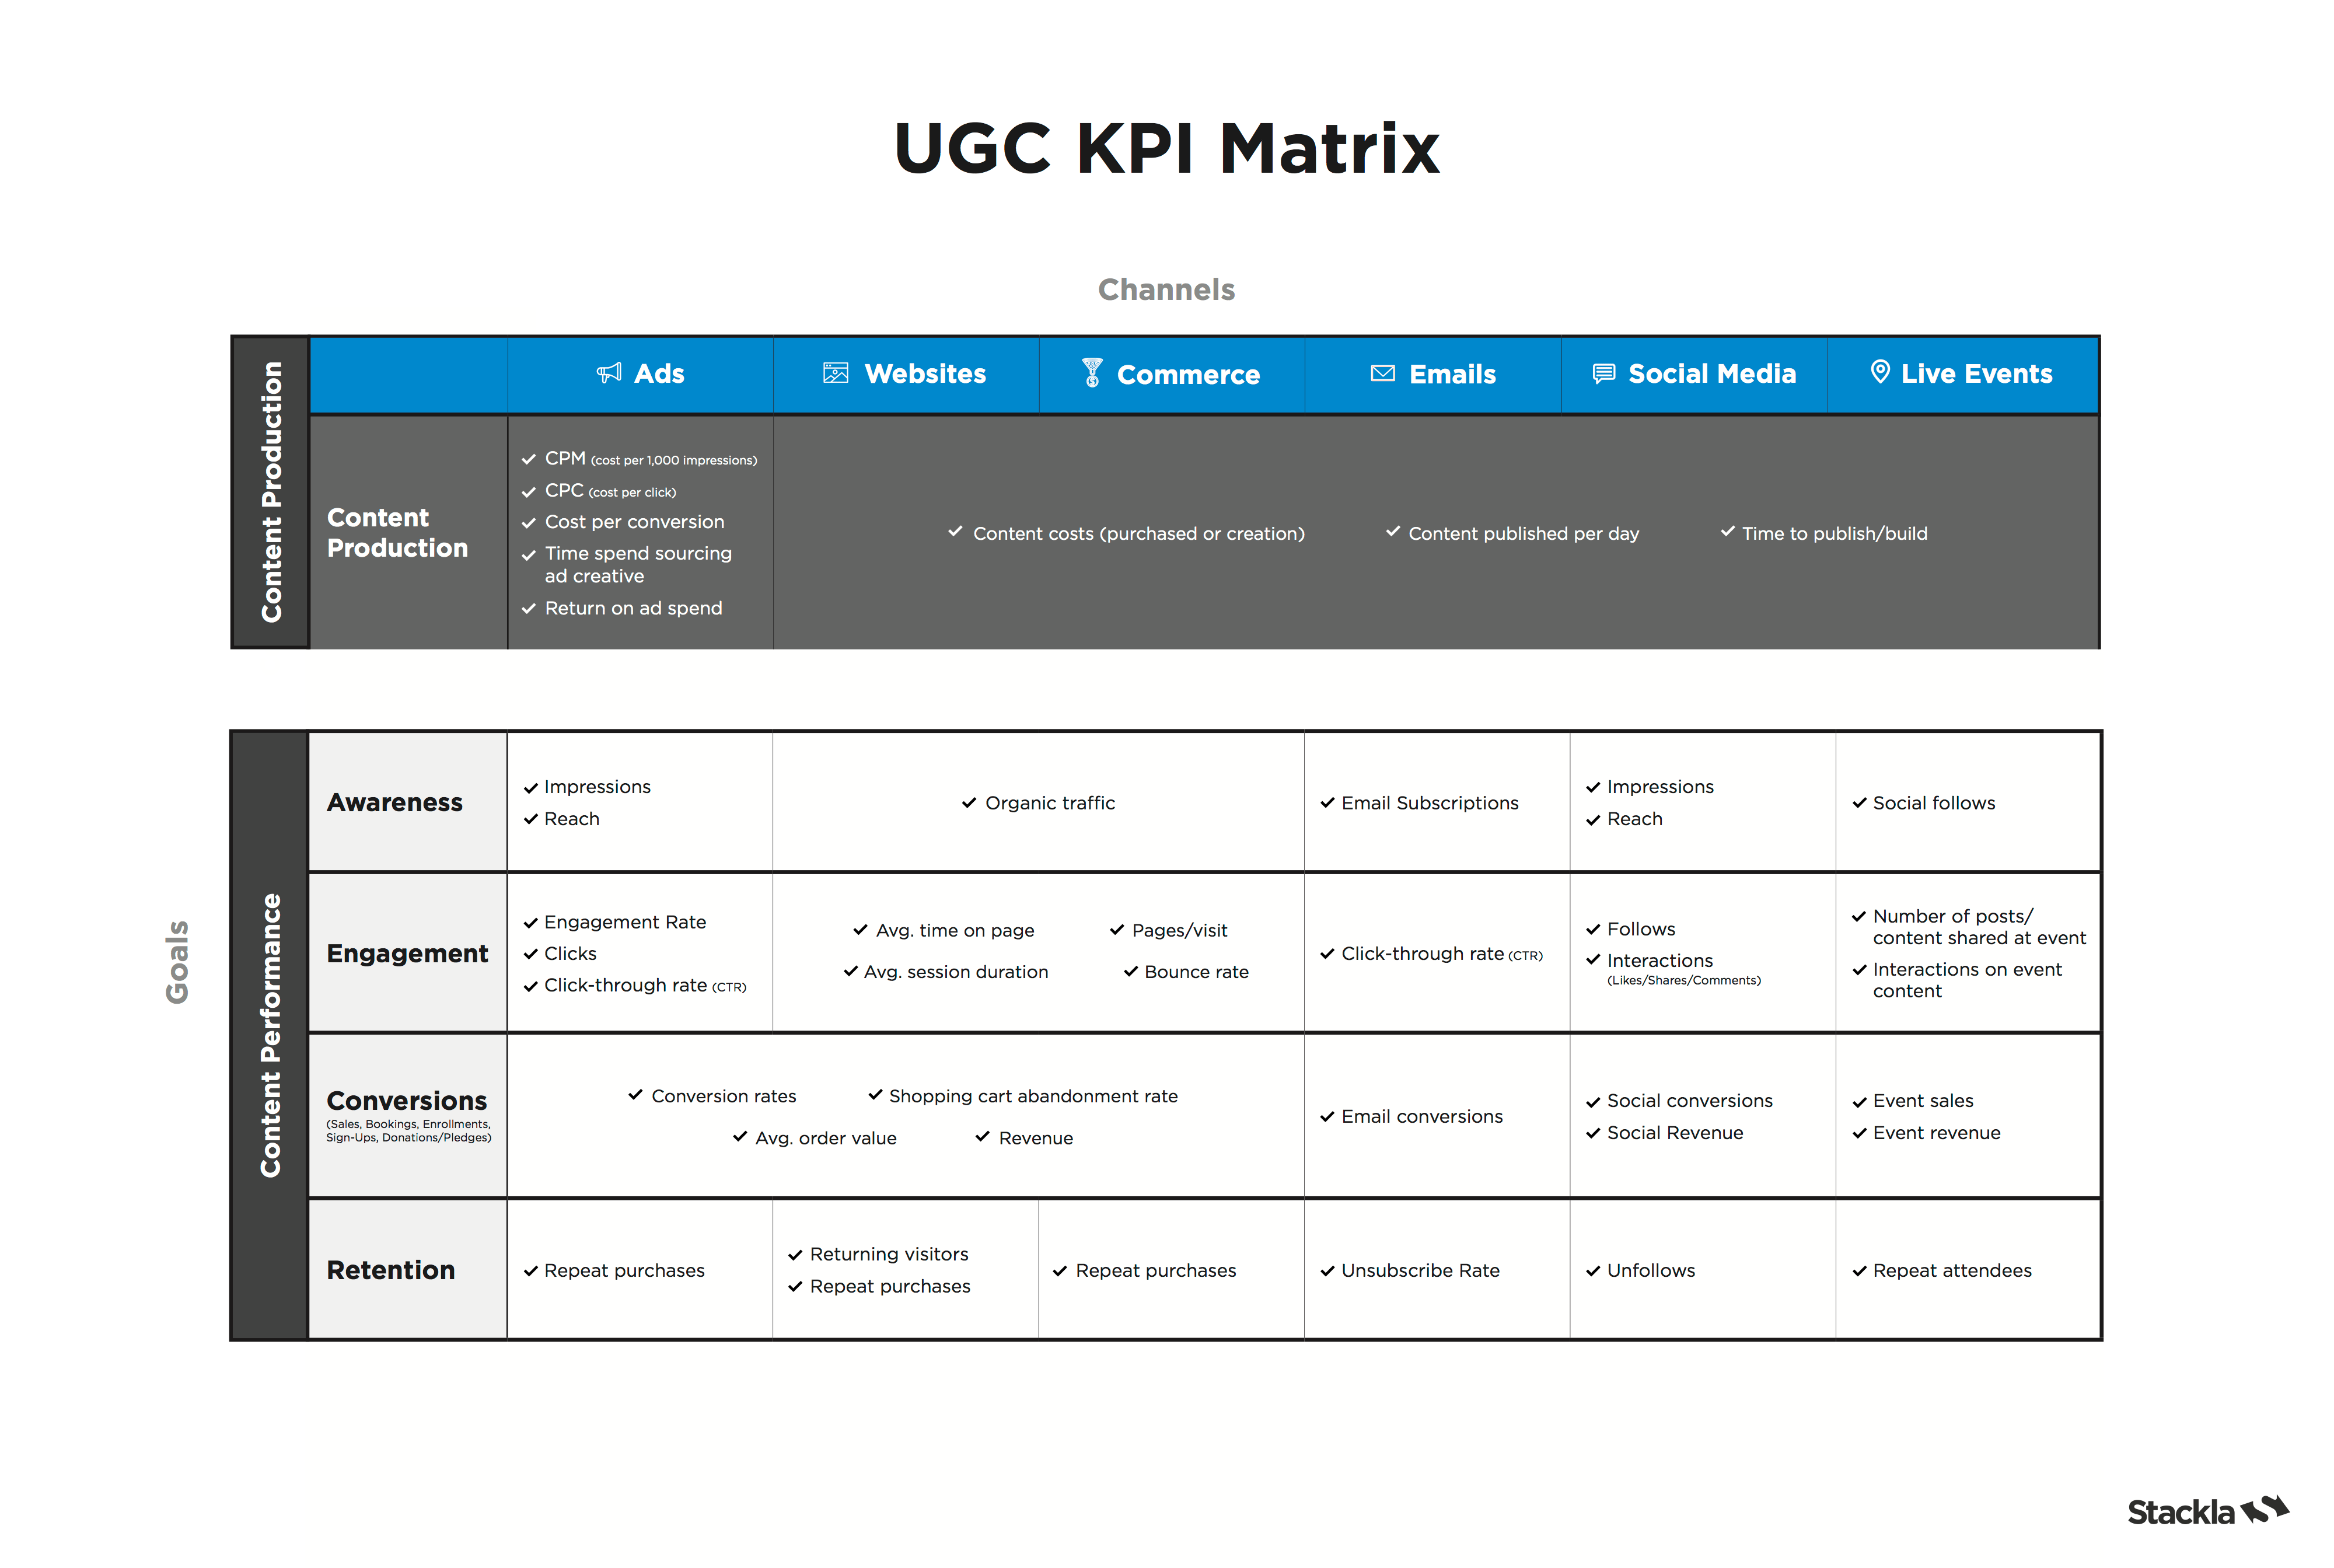
The UGC KPI Matrix
To help marketers more quickly and easily identify which ongoing and campaign-specific KPIs they should be tracking to measure the success of their user-generated content strategies, we’ve built this UGC KPI Matrix.
The Content Production section lays out the productivity metrics you should be tracking on an ongoing basis and the Content Performance gird below provides guidance around which performance-based metrics you should be tracking depending on your overarching goals and which distribution channels you’re leveraging.
For Stackla customers, we’ve created a Stackla-specific version of this KPI Matrix with additional guidance around particular product features, plugins and tools you’ll need to enable to begin working towards each goal and KPI.
Steps to Measuring Success
When planning your next UGC strategy or campaign, these are the steps you should take to benchmark and track your success:
- Establish the overarching goals you are trying to achieve
- Identify your UGC-specific KPIs based on your goals and distribution channels
- Benchmark those metrics before implementing your strategy or campaign
- Define numerical performance targets for each of your KPIs (i.e. increase CTR by 5%)
- Monitor your KPIs and make strategic adjustments when needed
- Rinse and repeat
Metric Glossary
Confused about any of the metrics featured in KPI matrix? Here’s a glossary to explain what every term means and how it’s calculated.
CONTENT PRODUCTION
Content Costs
How much you spend to produce or purchase visuals to support your marketing activities over a specific period of time (week, month, quarter, etc.).
Time to Publish
On average, how long does it take to move a piece of visual content from ideation to publication?
Cost Per Click (CPC) or Cost Per Impression (CPM)
Different types of ads have different costing metrics. The two most common are CPC (more common with social ads) and CPM (more common with display ads).
CPC, which is typically associated with social ads, is the amount you pay for each click your ad receives (Cost / Clicks = CPC).
CPM, is typically associated with display ads, is the amount you pay per 1,000 ad impressions. This number will be set by the display service or publication you’re running your ads through.
Return on Ad Spend (ROAS)
Measuring the efficacy of your digital ad spend, ROAS is calculated as Cost of Ad (over a month, quarter, etc.) / Ad Revenue (over the same time period) = ROAS (which can be displayed as a ratio or dollar amount).
Growth of Visual Asset Library
The number of new visual assets available for your brand to use across your marketing activities over a given period of time.
Rights Response Rate
Calculated as the number of rights requests sent / the number of rights approved content, your rights response rate tells you how likely it is that consumers will give you legal permission to the content they create about your brand (this will vary across brands and verticals).
CONTENT PERFORMANCE
Awareness
Impressions
The number of times your ad or social post is displayed. This number by itself is mainly used to calculate other key metrics. (Impression does not mean someone actually saw the ad, just that it was shown on a webpage or within a mobile app.)
Reach
The total number of people who have seen your content.
Organic Traffic
Traffic from search engine results that is earned, not paid.
Social Follows
The amount of new followers you gain across all your social channels during a campaign, competition or event.
Engagement
Engagement Rate
This metric applies to paid social where users can interact with your ads without actually clicking through to the ad landing page. The Engagement Rate is the percentage of interactions (likes, shares, comments) per ad impression. (Number of Interactions / Total Impressions) x 100 = Engagement Rate (%)
Interactions
The summation of impressions, likes, clicks, shares, comments. In Stackla tile interactions, this includes votes, shares, likes/dislikes and/or comments.
Pages/Session
The average number of pages a visitor views in a session.
Avg. Time on Page
The average amount of time users have spent on a specific webpage or landing page.
Avg. Session Duration
The average length of time a visitor spends on your website. Total Duration of All Sessions (in seconds) / Number of Sessions = Average Session Duration. (This one is a little tricky because Google can calculate it differently depending on whether there are “engagement hits” on the last page of a session. Learn more.)
Bounce Rate
The percentage of single-page sessions with no interactions. In other words, the percentage of people who came to a webpage, then left without clicking through or exploring your site.
Click-Through Rates (CTR) – Ads and Emails
The percentage of people who clicked an ad or an email link after viewing it. For ads, the calculation is (Clicks / Impressions) x 100 = CTR (%). For emails, it’s (Clicks / Delivered Emails) x 100 = CTR (%)
Volume of Posts
The amount of social posts about the event. This can be tracked through the use of an event hashtag and/or geolocation filters.
Conversions
Conversions
The number of desired actions taken by people across your website, ads, email or eCommerce pages (e.g. the number of purchases, bookings, downloads, signups, enrollments, donations, etc.).
Conversion Rate
The percentage of people who have taken a desired action after visiting your website, seeing an ad, opening an email, etc.
Revenue
The total revenue that can be directly attributed to conversions from digital ads, emails, websites, social commerce or live events.
Avg. Order Value
The average amount spent each time a customer places an order.
Shopping Cart Abandonment Rate
The ratio of abandoned online carts to the number of completed purchases. [ 1- ( number of completed purchases / number of shopping carts created)] x 100 = Shopping Cart Abandonment Rate (%).
Retention
Returning Visitors
The number of visitors that have returned to your site more than once in a given time period.
Repeat Purchase Rate
The percentage of your customer base that has come back to make a least a second purchase with your brand. (Number of customers who have shopped with you more than once / Total number of customers) x 100 = Repeat Purchase Rate (%).
Unsubscribe Rates (Opt-Out Rate)
The rate at which people unsubscribe or opt-out of your email communications.
Unfollow
The number of people who have stopped following your brand across your corporate social channels.
Repeat Attendees
The number of people who have attended more than one event that your brand has hosted over a given period of time.
Image source: Fabio