Announcing New Analytics Dashboards & Reports
Since data insights are the blueprint for any successful marketing strategy, we want to make it easier for you to measure what matters and quickly draw meaningful insights into how your user-generated content (UGC) is performing — not just on its own, but also within the context of your overall marketing strategy.
To do so, we’ve completely redesigned the analytics dashboards and reports within our platform, bringing together existing Stackla insights with your brand’s Google Analytics and Tracking Pixel data to form a new, centralized destination for you to:
- Understand how UGC performs within your broader content strategy – Whether you want to dig into a single slice or see the whole pie, our new dashboards provide a greater breadth and depth of insight into how your UGC is performing — on a Tile, Widget and Product Tag level — in relation to the other content on your site.
- See the ROI of social commerce – If your brand’s website also serves as an online storefront, Stackla-powered UGC can help to shorten the path to purchase and drive online conversions. Now, our new commerce dashboards make it easy to track the impact shoppable UGC is having on your visitor’s shopping behavior.
- Glean actionable email and Organic Influencer insights – Gain a deeper understanding of how audiences are engaging with UGC throughout your email activations and Organic Influencer communities to help optimize your ongoing and upcoming campaigns.
- Track content performance over time – Explore performance trends by setting custom date ranges to filter reporting views and compare results over time. Need to share results from specific time periods? PDF exports are now available on all new dashboards.
The Powerful Insights You Need, In One Centralized Dashboard
All Stackla customers now have access to our improved analytics. In your stacks under the Analyze section, you’ll now see following new dashboards:
- Performance
- Commerce
- Tile Interactions
- Organic Influencers
Performance Dashboard
Want to know how website visitors who interact with your Stackla-powered UGC compare to site visitors who don’t?
Our new Performance Dashboard does just that by showing a visual summary of your overall web metrics in direct comparison to the site metrics of people who’ve interacted with Stackla content on your site.
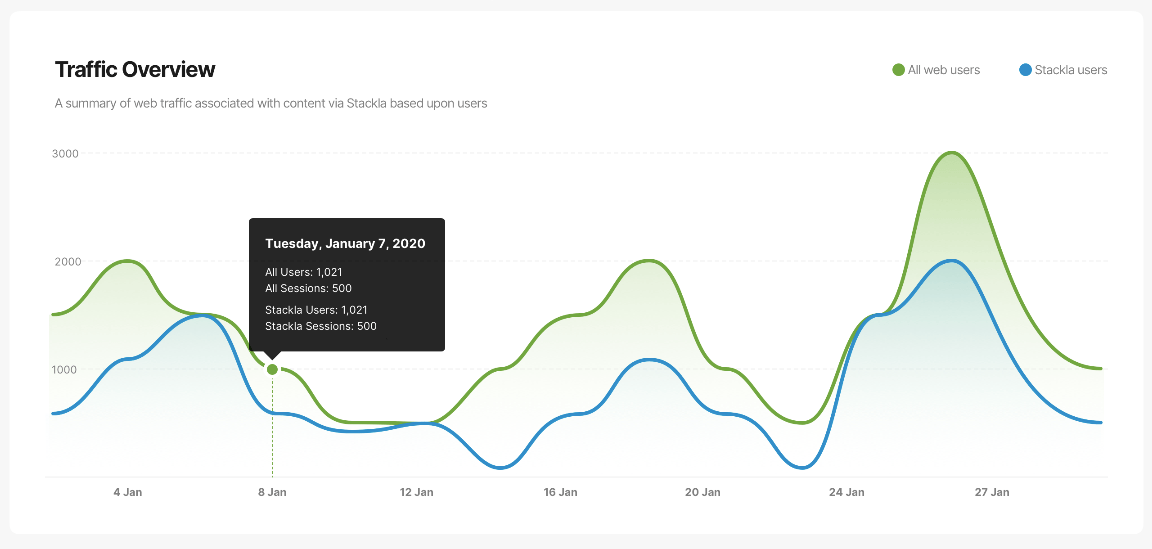
Since we’re using your brand’s Google Analytics (GA) data to help inform these dashboards, you’ll be able to drill down into Stackla user behavior vs all site users behavior across all top line GA metrics, including users, new users, sessions, pageviews, average session duration, average pages per session and bounce rate.
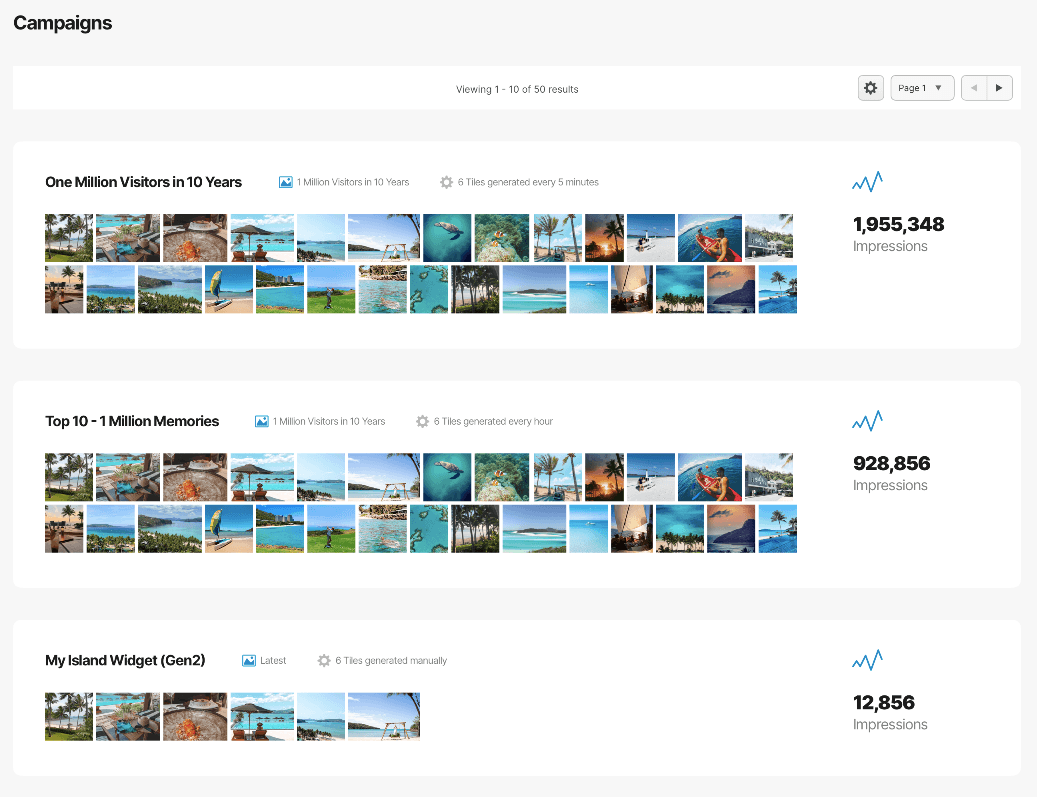
Your performance dashboard also displays data on the top tiles and widgets across your site.
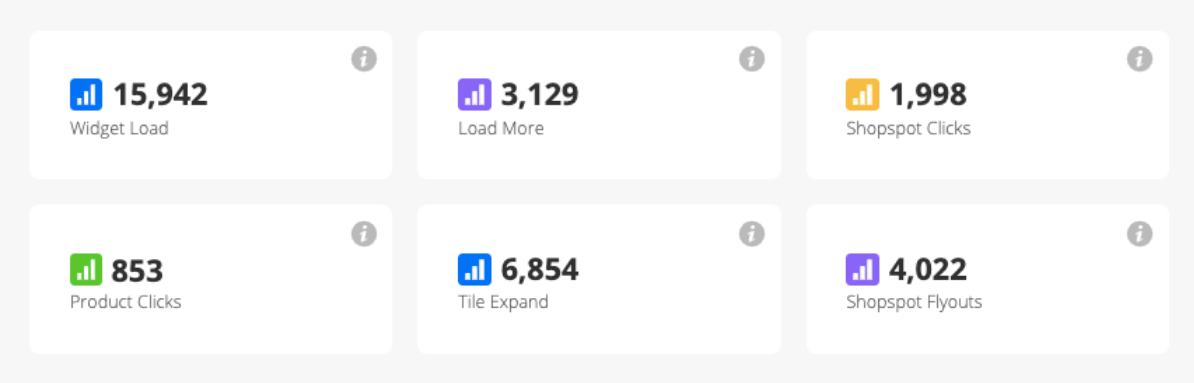
Want to drill down further into each specific widget? Hover over the widget and click “View Widget Analytics” to see that Individual Widget Report, which includes Stackla-specific data on things like widget loads, title expands, product clicks, shopspot clicks, etc.
The Individual Widget Report also compares the online and shopping behavior of visitors who have interacted with that particular widget with the online actions of other site visitors who have not.
Ever asked yourself: Do people who see or click on our UGC widgets stay on our site longer; or view more pages per session; or convert at a higher rate; or spend more per order? These dashboards are where you can quickly find these answers — and more.
This leads us to our high level commerce dashboards.
Commerce Dashboard
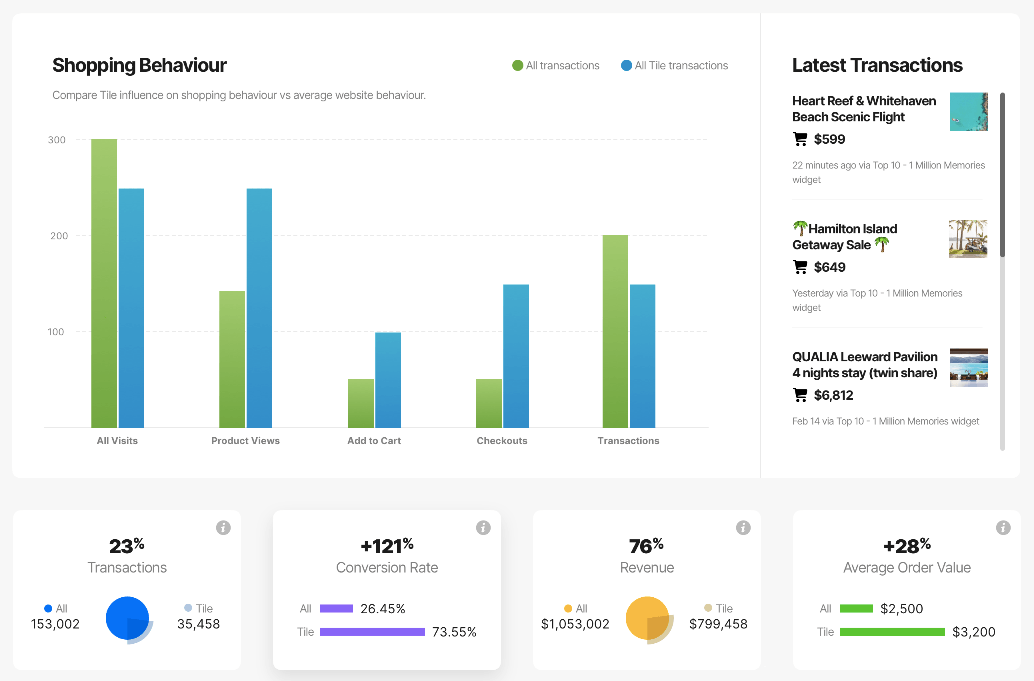
Similar to the Performance Dashboard, our new Commerce Dashboard provides an overview of how your published UGC is impacting shopping behavior across your website.
While the Individual Widget Report displays UGC’s influence on online transactions at the widget level, the Commerce Dashboards shows UGC’s influence at the tile level.
In this report, you can clearly see how the individual pieces of shoppable UGC on your site — meaning UGC with ShopSpots and/or Product Tags — are boosting your conversion rates as well as contributing to your online transactions, average order value and overall revenue.
Want to see which UGC Tiles are driving transactions in real time? Set up our Tracking Pixel to start seeing this extra level of purchasing detail within your commerce dashboard.
Email Dashboard
Offering a look into the performance of your UGC email widgets, our Email Dashboard provides insight into the impressions generated by these activations. This includes a breakdown of the traffic driven to your site by Stackla UGC email content vs all email referral traffic.
Additionally, this report highlights which of your UGC email campaigns have been the most successful.
Look out for more improvements to this dashboard later in 2020.
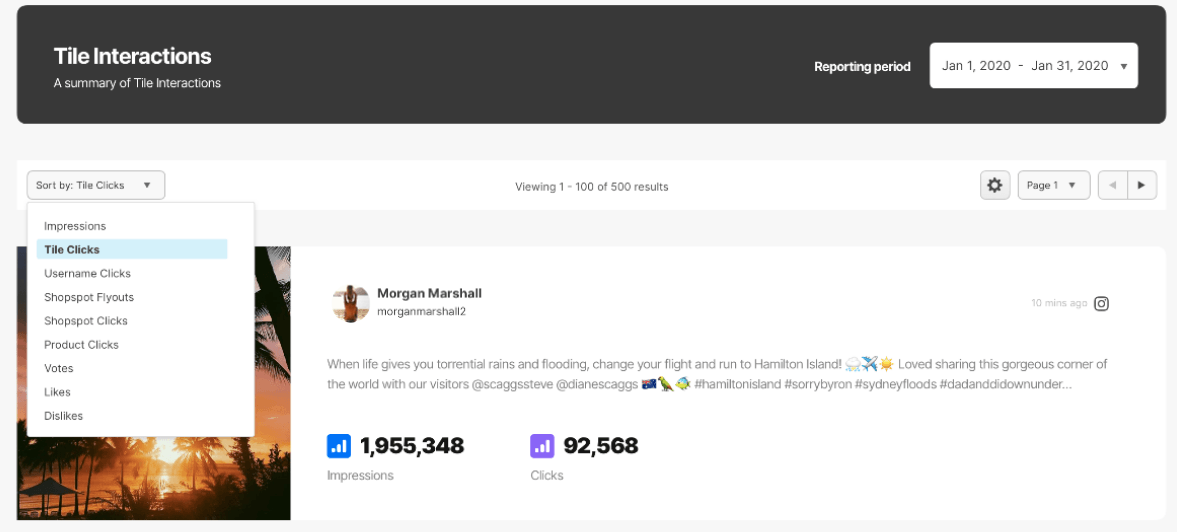
Tile Interactions Report
Our Tile Interactions Report has long been the most popular report in our platform. Now, it’s new and improved based on the feedback of customers like you.
This report still ranks your top tiles in descending order, but now you have the flexibility to enter custom date ranges and refine the list by the following options:
- Votes
- Likes
- Dislikes
- Impressions
- Tile Expands
- Shopspot Flyouts
- Product Clicks
- Shopspot Clicks
- Username Clicks
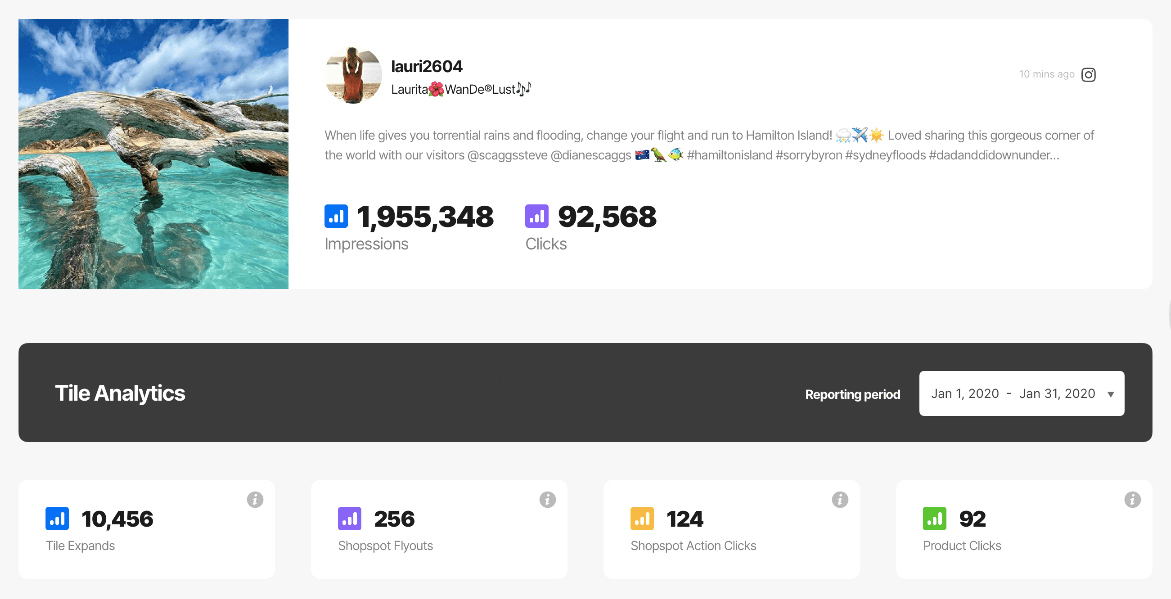
Hover over any UGC tile and you’ll be invited to “View Tile Analytics” for that specific piece of content. Once in the Individual Tile Report, you’ll be greeted with a granular view of the impact that piece of published UGC has had across your site.
This report will help you understand exactly how audiences have interacted with this content, how it has affected their behavior in comparison to visitors who didn’t view this content and how effective it has been in moving people through to purchase on your site.
Organic Influencers Dashboard
And last, but not least, our Organic Influencers dashboard provides a birds eye view of the following top line metrics:
- Top Contributors (by number of brief submissions)
- Top Contributor Engagement on Social
- Top Performing Organic Influencer Tiles on Stackla Widgets
- Submissions per Brief
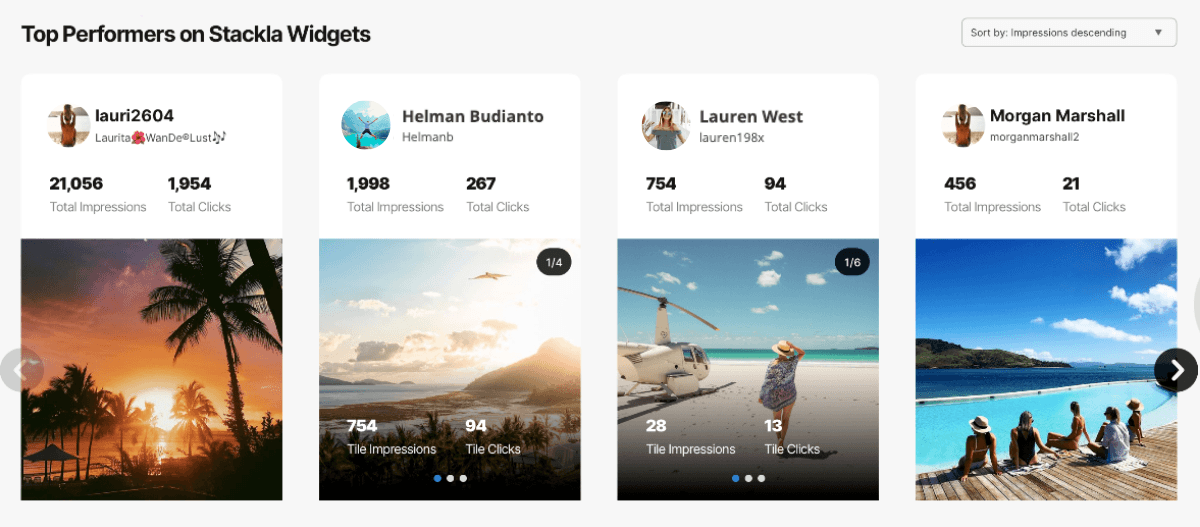
With this look into the health and impact of your Organic Influencer community, you can quickly and easily discover which creators and types of content are most impactful, then adjust your upcoming creative briefs and campaigns accordingly.
This is another dashboard to keep an eye on for more improvements throughout the year.
All these reports are available now! Start making better business decisions with more actionable insights.