17 Measurable Ecommerce Metrics That Drive Growth
Ecommerce managers, directors, and CDOs don’t need reminding that objectives should be measurable. But knowing which metrics actually drive growth? That’s where things get interesting.
At Nosto, we’ve helped over 1,500 global brands optimize their commerce experiences to convert better and grow smarter. Whether you’re reviewing quarterly OKRs or building campaign reports, these 17 measurable objectives focus on what actually matters—revenue, efficiency, and experience.
For a quick primer on setting clear, impactful goals, it’s worth revisiting the S.M.A.R.T. framework—specific, measurable, attainable, realistic, and time-based. This Atlassian guide remains one of the most visited resources on the topic.
1. Grow quality traffic to your ecommerce site
Metrics to track:
- Total site sessions
- % new sessions
- Unique pageviews
- Average session duration
Use case: Combine product-led blog content with smart internal linking and Product Recommendations to push traffic toward your best-converting pages.

2. Increase conversions across the customer journey
Metrics to track:
- Conversion rate
- Total conversions
Tactics to test:
- On PDPs, implement Shoppable UGC to build trust and reduce hesitation.
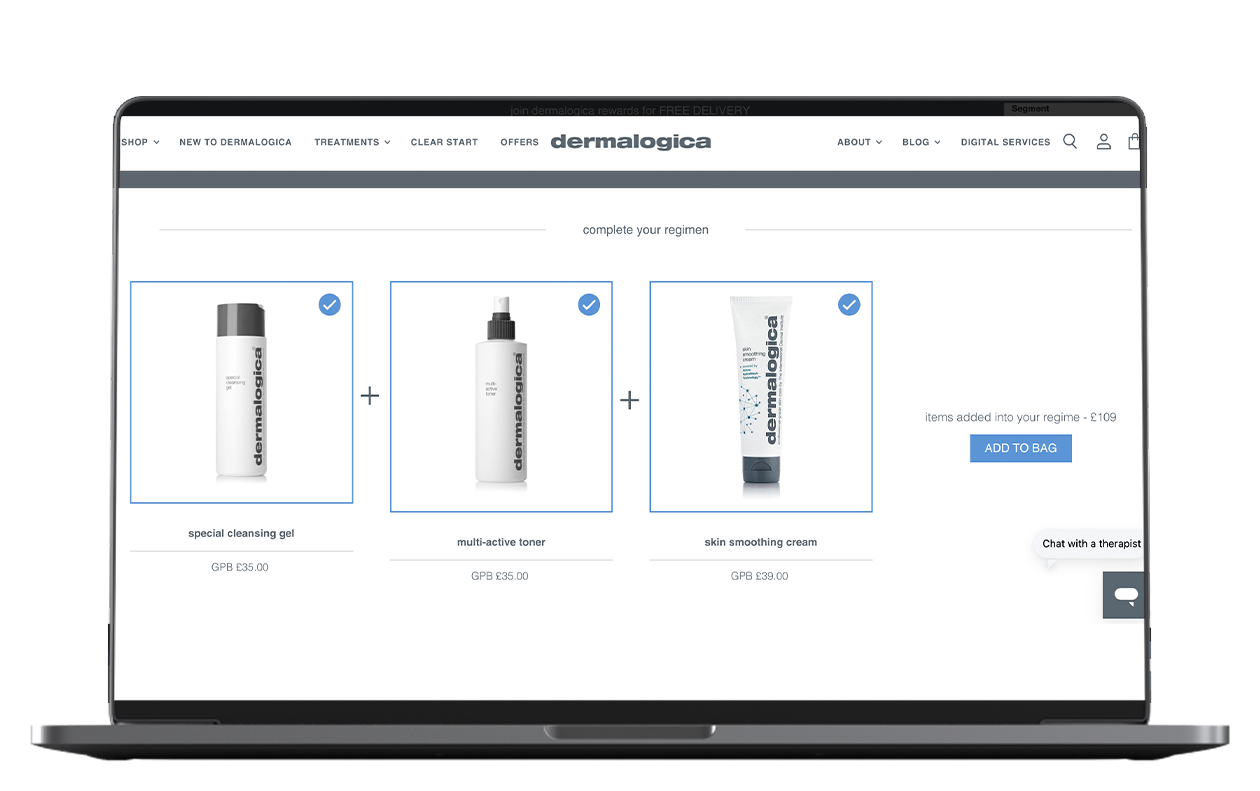
- Use Dynamic Bundles to recommend frequently bought together items and raise AOV without additional ad spend. Dermalogica use Dynamic bundles on their site. For example, if a customer visits a moisturizer product detail page (PDP), they will see an exfoliant, cleanser, and toner, all with attributes that tie them closely to the viewed product and therefore make them a perfect match.
3. Maximize event-based or campaign engagement
Metrics to track:
- Volume of social mentions
- Social interactions
- Follower growth
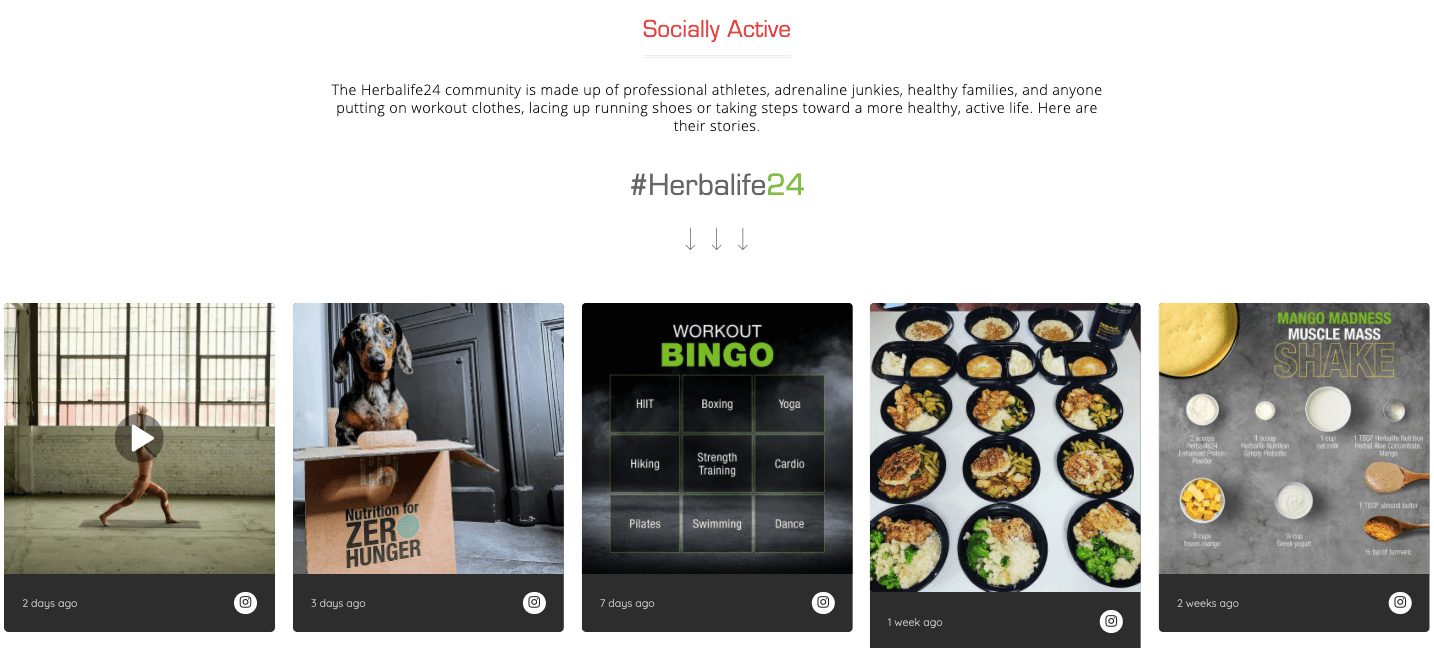
Example: Add a live gallery of campaign-specific content via Shoppable UGC to your homepage. It keeps your campaign visually engaging and community-driven. Realizing how effective UGC can be at telling their brand story, Herbalife showcase inspiring customer and distributor content on their Herbalife Nutrition Fitness websites.
4. Improve blog or content hub performance
Metrics to track:
- Pageviews
- Engagement metrics (scroll depth, shares, clicks)
Optimization tip: Pair editorial content with product discovery tools. For example, insert Product Recommendations directly into blogs to bridge content and commerce.
5. Boost awareness through better ad performance
Metrics to track:
- Impressions
- Engagement rate
- CTR / CPC
Pro tip: Using real customer content – UGC – in ads is proven to outperform brand-only creative. It’s social proof, at scale.
6. Drive email and paid campaign performance
Metrics to track:
- Click-through rate
- Landing page conversion
- List growth and unsubscribe rate
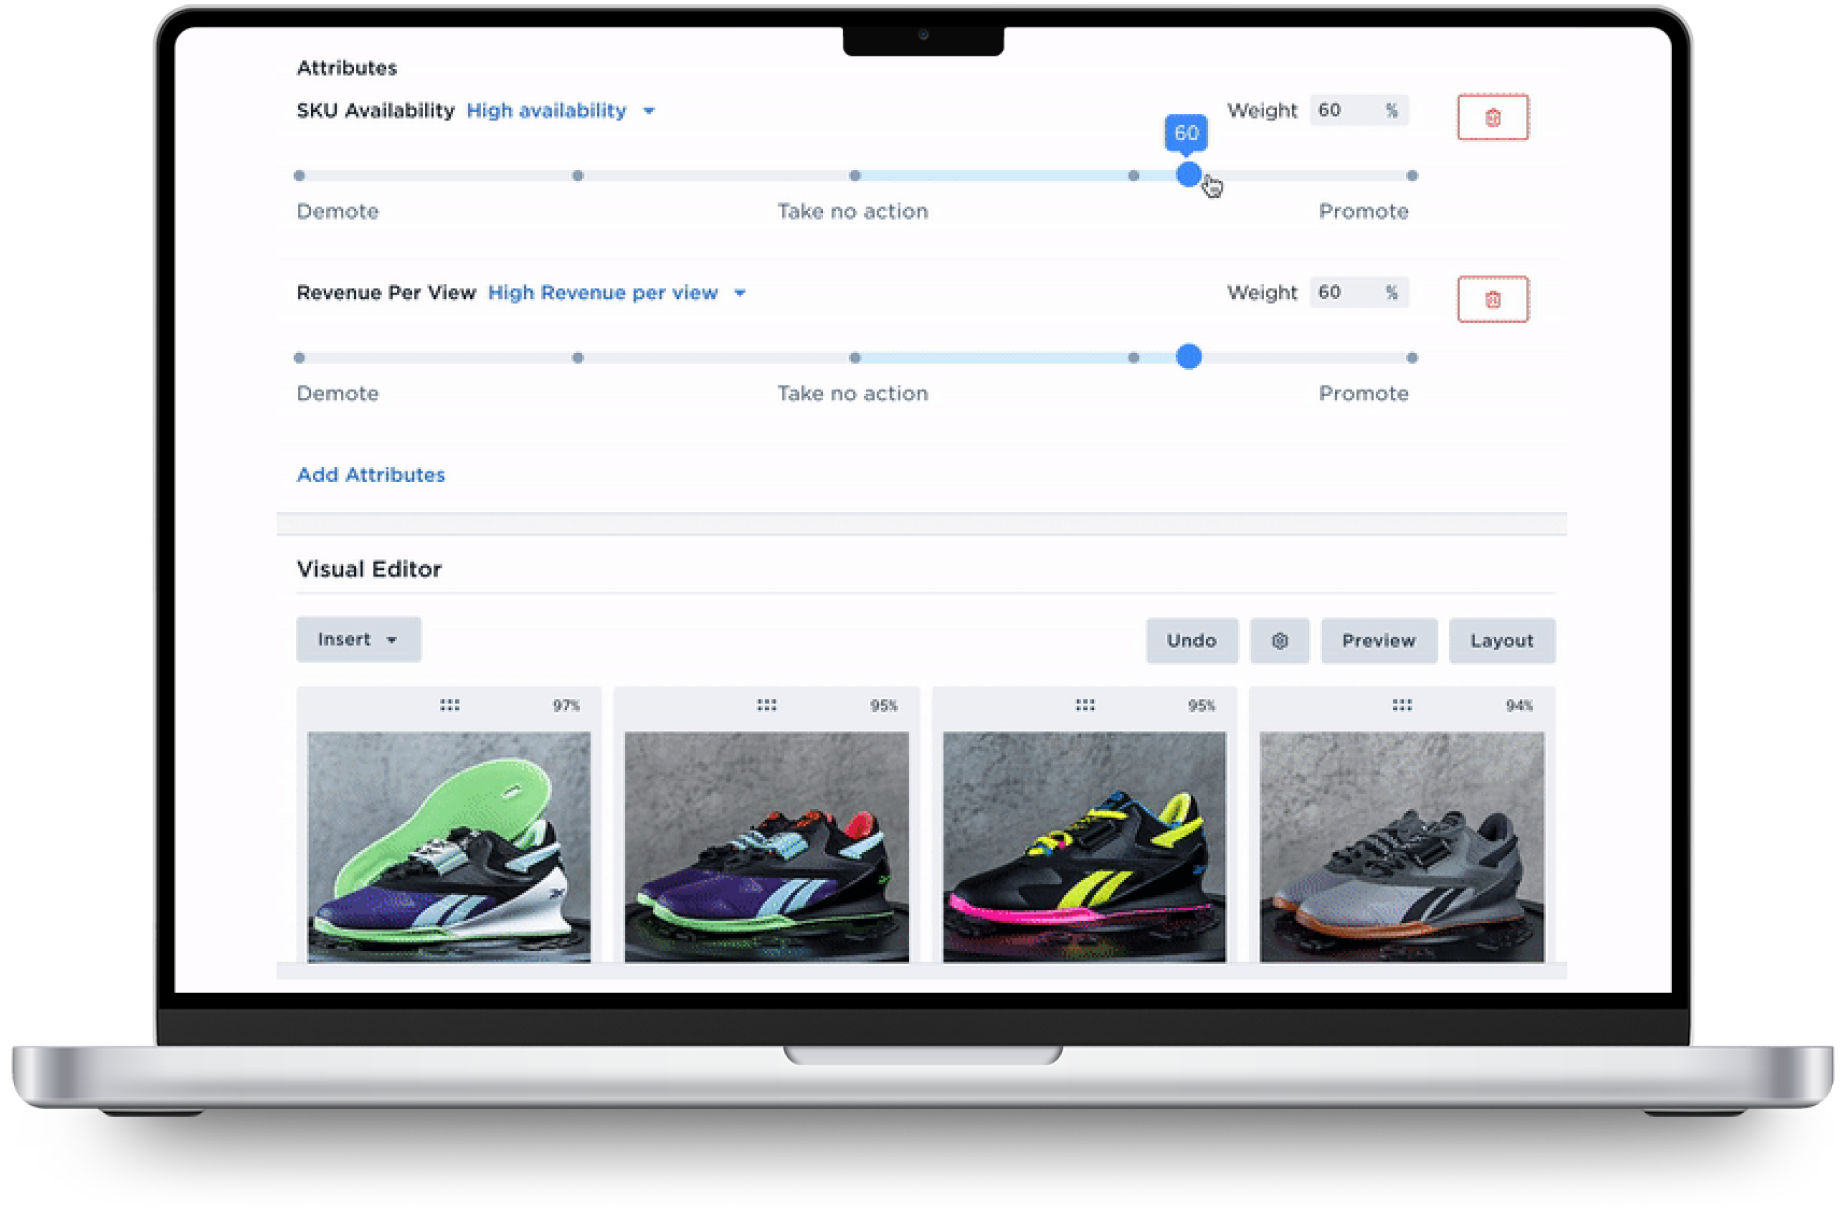
Tip: Align campaign links with tailored category pages. With Category Merchandising, you can reorder products by behavior, affinity, or inventory performance.
The WOD Life implemented Category Merchandising on their website to drive more discovery for their new arrivals and increase conversion.
7. Scale smarter with cost-efficiency metrics
Metrics to track:
- CPC
- CPM
- CPA
Tactics to try:
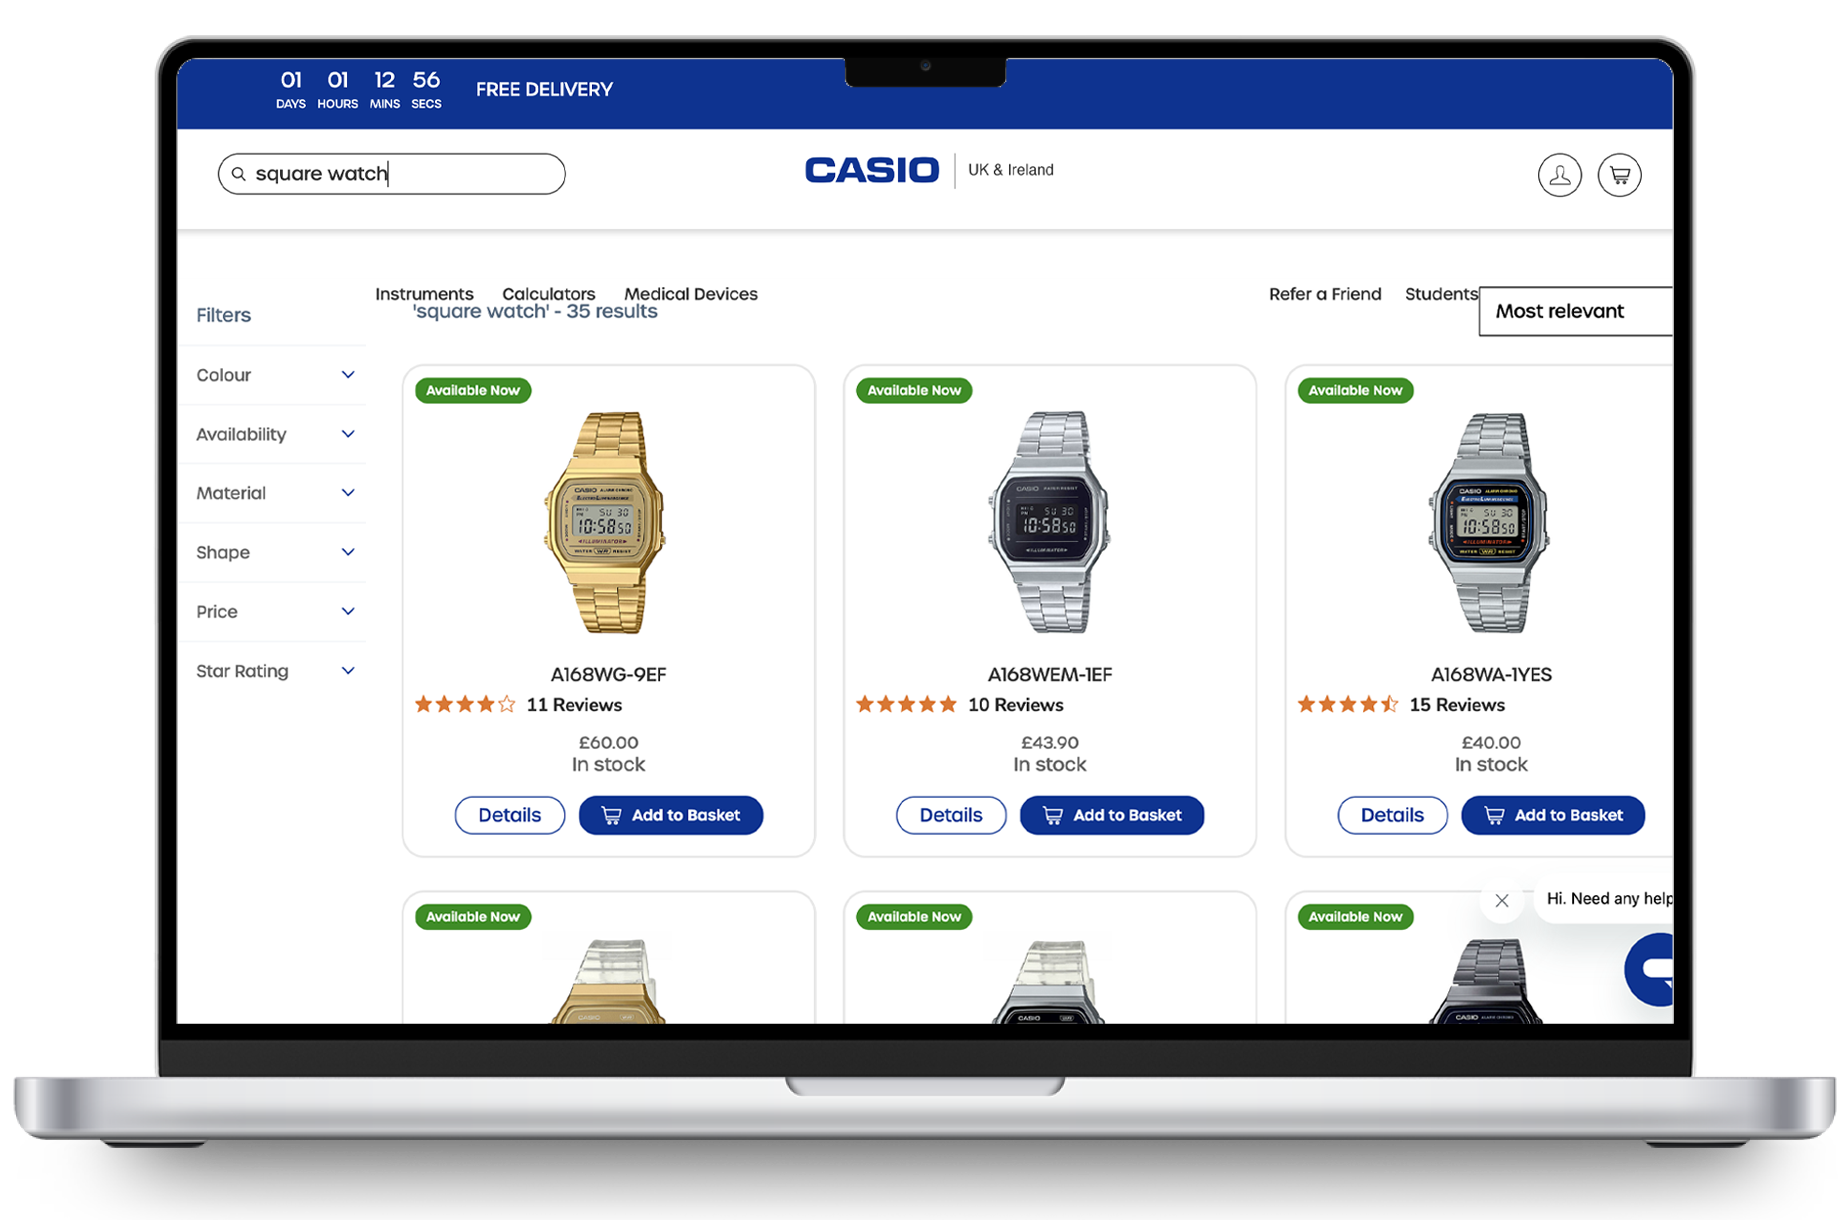
- Optimize your internal search with Personalized Search so customers find what they want—faster. By implementing Nosto’s AI-powered search, Casio provide a hyper-relevant search experience that improves product discovery
- Use Dynamic Bundles to turn a single item purchase into a multi-item basket, improving return per click without added acquisition cost.
Final Word
You don’t need more metrics—you need the right ones.
These 17 marketing objectives are grounded in performance and proven to impact conversion, efficiency, and lifetime value. Whether you’re overseeing search optimization, UX experiments, or campaign performance, this is your starting point.
Need help activating any of these strategies? Let’s talk.