Black Friday Cyber Monday 2022 retail performance (as it happened!)
The biggest weekend in retail has been (but was it? ??). With COVID-19 affecting the traditional shopping frenzy and inflationary pressures rocketing since, it was difficult to know what would happen this year.
From Black Friday 2022, we monitored retail performance across millions of Nosto-powered interactions, on over 1200 global retail stores, updating daily performance as the weekend unveiled. Firstly, we share our key takeaways of the weekend, then break down the data in full. Enjoy!
Key takeaways
Black Friday Cyber Monday weekend as a whole
- AOV was up across the board, but CR was down
- The UK was the only region to see an increase in CR year-on-year
- There was an overall increase in traffic (5.4%), sales (8.9%), AOV (6.2%), but a decrease in conversion rate (3.4%) year-on-year
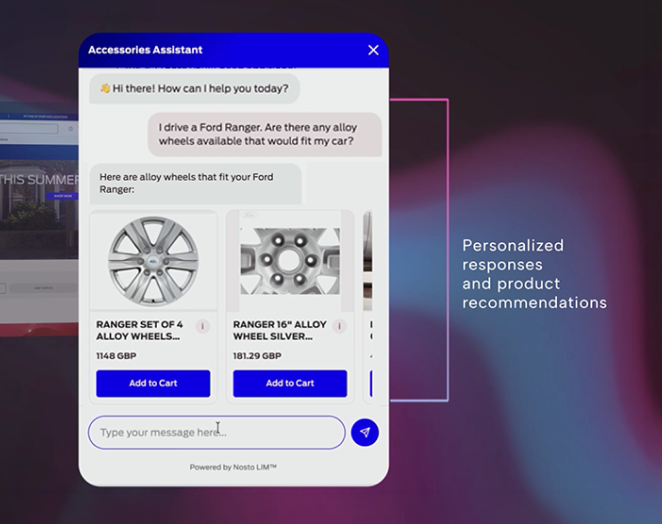
- There were 608 million personalized Product Recommendations shown, and 97,000 Pop-Ups
- There were 107 million visits across the weekend, showing a 21.6% increase in visits year-on-year
- Time spent on page increased 8.4% year-on-year
Performance by device
- 26.6% of the traffic came from desktop; 73.4% came from mobile
- 36.8% of sales came from desktop, 63.2% from mobile—but desktop wins for AOV ($126.1 desktop vs $99.6 mobile)
- CR was higher on desktop (4.5%) than on mobile (3.6%), even though it decreased by 12% year-on-year, while mobile increased 0.6% year-on-year
Performance by day
- Black Friday beat CM in terms of traffic
- CM saw the biggest year-on-year increases, including for traffic (7.5%), sales (11.7%), and AOV (7.6%), but also saw a drop in conversion rate (-4.6%)
Performance by region
- The UK was the only region to see a year-on-year increase in CR, (+15.7%)
- The UK saw a year-on-year decrease in traffic (-2.8%) but increase in sales (+10.5%)
- The US saw the best year-on-year increases, with traffic upping 12.5%, sales 14.7%, and AOV 10.6%
- Conversion rates peaked on Black Friday for all regions other than US, which peaked Saturday
Performance by vertical
- Health & Beauty saw the strongest year-on-year increases compared to other categories, with traffic up 13.5%, sales 22.6%, AOV 1.2%, and CR 7.5%
- Fashion saw the biggest year-on-year increase in AOV, up 9.8%, despite seeing biggest drop in CR, of 11.3%
- Sporting goods and hobbies saw biggest year-on-year increase in CR, of +18.8%
Overall Black Friday Cyber Monday weekend performance
- Overall visits 107,331,786
- Number of personalized Product Recommendations served: 3,038,482,745
- Number of Pop-ups served 96,817
- Avg. conversion rate 3.8%
- Most successful day for traffic: Black Friday
- Most successful day for conversion rate: Black Friday
Year-on-year performance
- Year-on-year increase in traffic: 5.4%
- Year-on-year increase in sales: 8.9%
- Year-on-year increase in AOV: 6.2%
- Year-on-year decrease in conversion rate: 3.4%
- Year-on-year increase in time spent on page: 8.4%
Performance by day
Black Friday
Black Friday kicked off the weekend on a very strong note, seeing substantial year-on-year increases across traffic, sales, and average order value.
Year-on-year performance
- Year-on-year increase in traffic 6.3%
- Year-on-year increase in sales 8.4%
- Year-on-year increase in AOV 4.9%
- Year-on-year decrease in conversion rate 3.1%
- Peak hour for traffic 16:00-17:00 UTC
- Peak hour for conversions 22:00-23:00
Overall visits: 30,947,168
Saturday
The numbers came out strong on Saturday, too, with year-on-year increases in traffic, sales, and AOV.
Year-on-year performance
- Year-on-year increase in traffic 3.2%
- Year-on-year increase in sales 7.7%
- Year-on-year increase in AOV 6.1%
- Year-on-year decrease in conversion rate 2.4%
- Peak hour for traffic 20:00-21:00 UTC
- Peak hour for conversions 04:00-05:00
Overall visits: 25,111,112
Sunday
Sunday’s results followed suit, with increases across the board, other than for conversion rate which, like Friday and Saturday, saw a year-on-year dip.
Year-on-year performance
- Year-on-year increase in traffic 4.3%
- Year-on-year increase in sales 7.6%
- Year-on-year increase in AOV 6.8%
- Year-on-year decrease in conversion rate 3.8%
- Peak hour for traffic 20:00-21:00 UTC
- Peak hour for conversions 21:00-22:00 UTC
Overall visits: 24,410,454
Cyber Monday
Cyber Monday was no exception to the trend. In fact, the increases and decreases here were in the same places, and the most significant of all days.
Year-on-year performance
- Year-on-year increase in traffic 7.5%
- Year-on-year increase in sales 11.7%
- Year-on-year increase in AOV 7.6%
- Year-on-year decrease in conversion rate 4.6%
- Peak hour for traffic 20:00 UTC
- Peak hour for conversions 22:00
Overall visits: 26,863,052
Performance by device
Desktop vs. mobile
- Desktop traffic 26.6% vs. mobile traffic 73.4% (percentage share)
- Desktop sales 36.8% vs. mobile sales 63.2% (percentage share)
- Desktop orders 31.5% vs. mobile orders 68.5% (percentage share)
- AOV on desktop $126.1 vs. AOV on mobile $99.6
- Desktop conversion rate 4.5% vs. mobile conversion rate 3.6%
Desktop year-on-year performance
- Traffic 9.6% increase
- Sales 4.7% increase
- AOV 7.4% increase
- Conversion rate 12% decrease
Mobile year-on-year performance
- Traffic 4.0% increase
- Sales 11.5% increase
- AOV 6.2 increase
- Conversion rate 0.6% decrease
Performance by region
North America
Year-on-year performance
- Traffic 12.5% increase
- Sales 14.7% increase
- AOV 10.6% increase
- Conversion rate 8.9% decrease
United Kingdom
Year-on-year performance
- Traffic 2.8% decrease
- Sales 10.5% increase
- AOV 0.4% decrease
- Conversion rate 15.1% increase
Europe
Year-on-year performance
- Traffic 0.2% increase
- Sales 5.1% decrease
- AOV 3.2% increase
- Conversion rate 8.7% decrease
Performance by vertical
Fashion & Accessories
Year-on-year performance
- Traffic 9.4% increase
- Sales 8.3% increase
- AOV 9.8% increase
- Conversion rate 11.3% decrease
Health & Beauty
Year-on-year performance
- Traffic 13.5% increase
- Sales 22.6% increase
- AOV 1.2% increase
- Conversion rate 7.5% increase
Home, Garden & DIY
Year-on-year performance
- Traffic 3.3% decrease
- Sales 5.9% decrease
- AOV 5.5% increase
- Conversion rate 8.0% decrease
Sporting Goods & Hobbies
Year-on-year performance
- Traffic 0.1% decrease
- Sales 21.2% increase
- AOV 2.2% increase
- Conversion rate 18.9% increase
Performance by platform
Shopify
- Most successful day for traffic: Black Friday
- Most successful day for conversions: Black Friday
- Number of Recommendations served: 1,954,273,400
- Number of Pop-Ups served: 28,906
- Average conversion rate: 4.4%
Year-on-year performance
- Traffic 9.5% increase
- Sales 16.4% increase
- AOV 8.3% increase
- Conversion rate 2.4% decrease
Magento
- Most successful day for traffic: Black Friday
- Most successful day for conversions: Black Friday
- Number of Recommendations served: 424,696,650
- Number of Pop-Ups served: 21,704
- Average conversion rate: 2.5%
Year-on-year performance
- Traffic 6.0% increase
- Sales 0.9% decrease
- AOV 4.8% increase
- Conversion rate 11.6% decrease
Prestashop
- Most successful day for traffic: Black Friday
- Most successful day for conversions: Black Friday
- Number of Recommendations served: 73,887,725
- Number of Pop-Ups served: 1,661
- Average conversion rate: 2.2%
Year-on-year performance
- Traffic 1.1% decrease
- Sales 9.9% decrease
- AOV 10.2% increase
- Conversion rate 17.0% decrease
Other
- Most successful day for traffic: Black Friday
- Most successful day for conversions: Sunday
- Number of Recommendations served: 585,624,970
- Number of Pop-Ups served: 44,546
- Average conversion rate 3.1%
Year-on-year performance
- Traffic 6.5% decrease
- Sales 8.9% decrease
- AOV 1.1% increase
- Conversion rate 3.4% decrease
About the data
Nosto’s findings are based on an analysis of over 107 million visits during BFCM weekend to over 1,200 online stores that use Nosto’s Commerce Experience Platform (CXP). These include merchants in North America, Europe, Latin America, and Asia Pacific. The analysis incorporates data for the period between November 25, 00:00 UTC, to November 28, 00:00 UTC and compares seasonal performance metrics against Nosto merchant websites in 2021. All financial figures are in USD.
BFCM 2024 is upon us
Bookmark this article and be the first to hear how ecommerce performs over BFCM 2024.