BFCM Holiday Shopping Statistics 2025
The frenzy of Cyber weekend 2025 has now passed! And we’ve wrapped up our annual breakdown of ecommerce performance. Analyzing over a hundred million website visits to over a thousand Nosto-powered stores, here’s your breakdown of how retail’s most anticipated weekend looked for ecommerce this year.
Overall weekend performance
Percentages represent year-on-year increases and decreases.
- Traffic: -1.9 %
- Sales: +17.4 %
- CVR +19.21 %
- Orders: +17.31 %
- AOV: +0.07 %
Performance by day
Black Friday 2025
Percentages represent year-on-year increases and decreases.
- Traffic: -1.72 %
- Sales: +15.17 %
- Conversion rate: +16.21 %
- Orders: +14.53 %
- AOV: + 0.55 %
Saturday 2025
Percentages represent year-on-year increases and decreases.
- Traffic: -2.68%
- Sales: +20.23%
- Conversion rate: +22.83%
- Orders: +20.02%
- AOV: +0.17%
Sunday 2025
Percentages represent year-on-year increases and decreases.
- Traffic: -0.69%
- Sales: +20.23%
- Conversion rate: +19.65%
- Orders: +19.2%
- AOV: +0.87%
Cyber Monday 2025
Percentages represent year-on-year increases and decreases.
- Traffic: -2.47%
- Sales: +15.19%
- Conversion rate: +19.28%
- Orders: +16.68%
- AOV: -1.27%
Performance by device
Mobile
Percentages represent year-on-year increases and decreases.
- Traffic: +0.12 %
- Conversion rate: +22.54 %
- Sales: +17.6 %
- Orders: +23.06 %
- AOV: -4.43 %
Desktop
Percentages represent year-on-year increases and decreases.
- Traffic: -7.17 %
- Conversion rate: +14.66 %
- Sales: +17.08 %
- AOV: +9.52 %
- Orders: +6.9 %
Mobile vs desktop
Figures represent percentage share.
Traffic
- Mobile: 74.32 %
- Desktop: 25.68 %
Conversion rate
- Mobile: 2.59 %
- Desktop: 3.61 %
Sales
- Mobile: 61.88 %
- Desktop: 38.12 %
Orders
- Mobile: 67.25 %
- Desktop: 32.75 %
Performance by region
Percentages represent year-on-year increases and decreases.
North America
- Conversion rate: +32.41 %
- Sales: +17.71 %
- AOV: -1.57 %
- Orders: +19.59 %
United Kingdom
- Conversion rate: +25.99 %
- Sales: +12.42 %
- AOV: +7.09 %
- Orders: +4.98 %
Europe
- Conversion rate: -10.18 %
- Sales: +19.66 %
- AOV: +3.25 %
- Orders: +15.9 %
APAC
- Conversion rate: -14.07 %
- Sales: -0.34 %
- AOV: -6.05 %
- Orders: +6.08 %
Performance by platform
Percentages represent year-on-year increases and decreases.
Shopify
- Conversion rate: +24.88 %
- Sales: +18.46 %
- AOV: +0.5 %
- Orders: +17.87 %
Magento
- Conversion rate: +14.01 %
- Sales: +19.37 %
- AOV: +14.27 %
- Orders: +4.47 %
Prestashop
- Conversion rate: +0.03 %
- Sales: +24.82
- AOV: +18.85 %
- Orders: +5.02 %
Other
- Conversion rate: -3.14 %
- Sales: +10.83
- AOV: -12.86 %
- Orders: +27.2 %
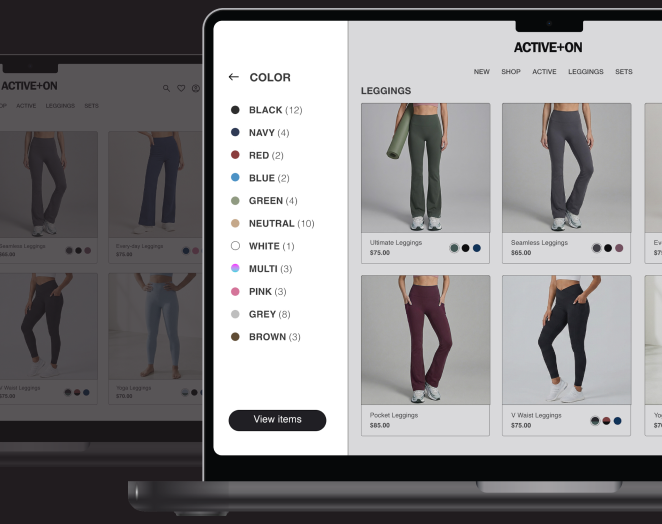
Product and content discovery campaign performance
Percentages represent year-on-year increases and decreases.
Product Recommendations
- Sales: +14.38%
- AOV: +0.48%
- Time Spent: +4.39%
Personalized Search
- Sales: +32.75%
- AOV: +4.24%
- Time spent: +7.03%
Content Personalization
- Sales: +4.38%
- AOV: +2.40%
- Time Spent: +0.35%
Category Merchandising
- Sales: + 34.75%
- AOV: +1.95%
- Time spent: +4.35%
Post-BFCM planning
Once the peak weekend passes, the real opportunity begins. With traffic at its highest and a wave of new shoppers freshly acquired, the weeks that follow BFCM are all about retention—turning those one-time buyers into loyal, high-value customers and driving revenue well into Q1.
To help you make the most of this post-peak period, we’re partnering with Klaviyo on Dec 11 for an upcoming webinar focused entirely on post-BFCM retention.