July 16, 2025 Making sense of the 2025 Gartner® Magic Quadrant™ for Search & Product Discovery Read more
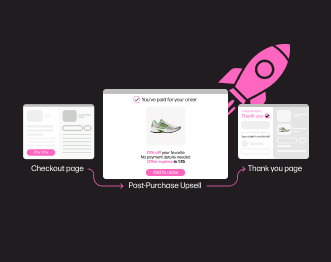
June 24, 2025 5 Minute Read Grow AOV & profit with Post-Purchase Upsell for Shopify checkout Read more
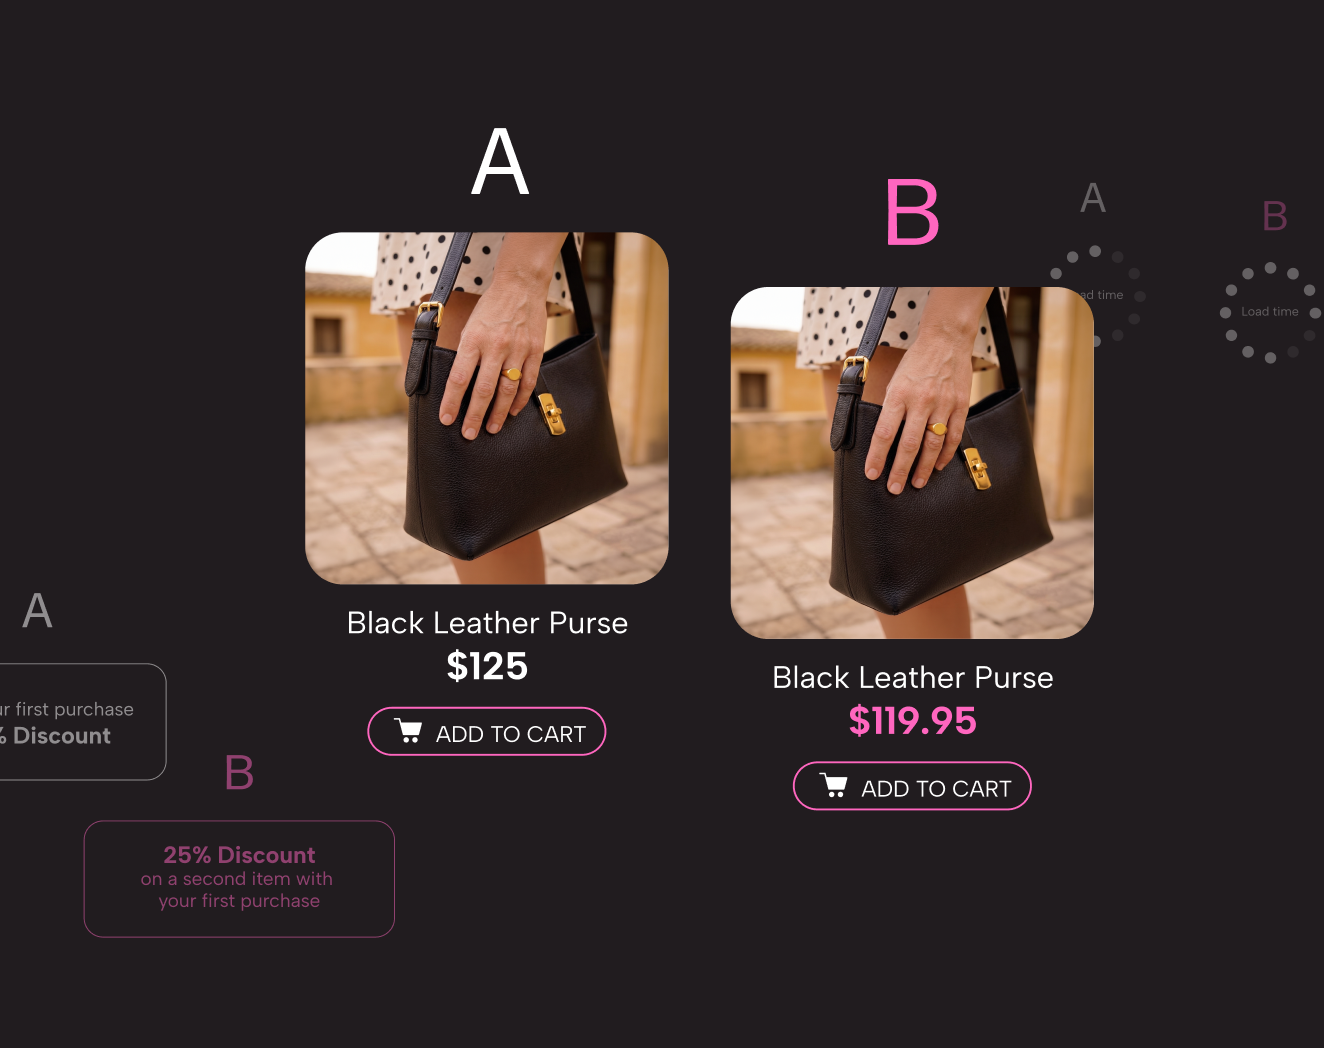
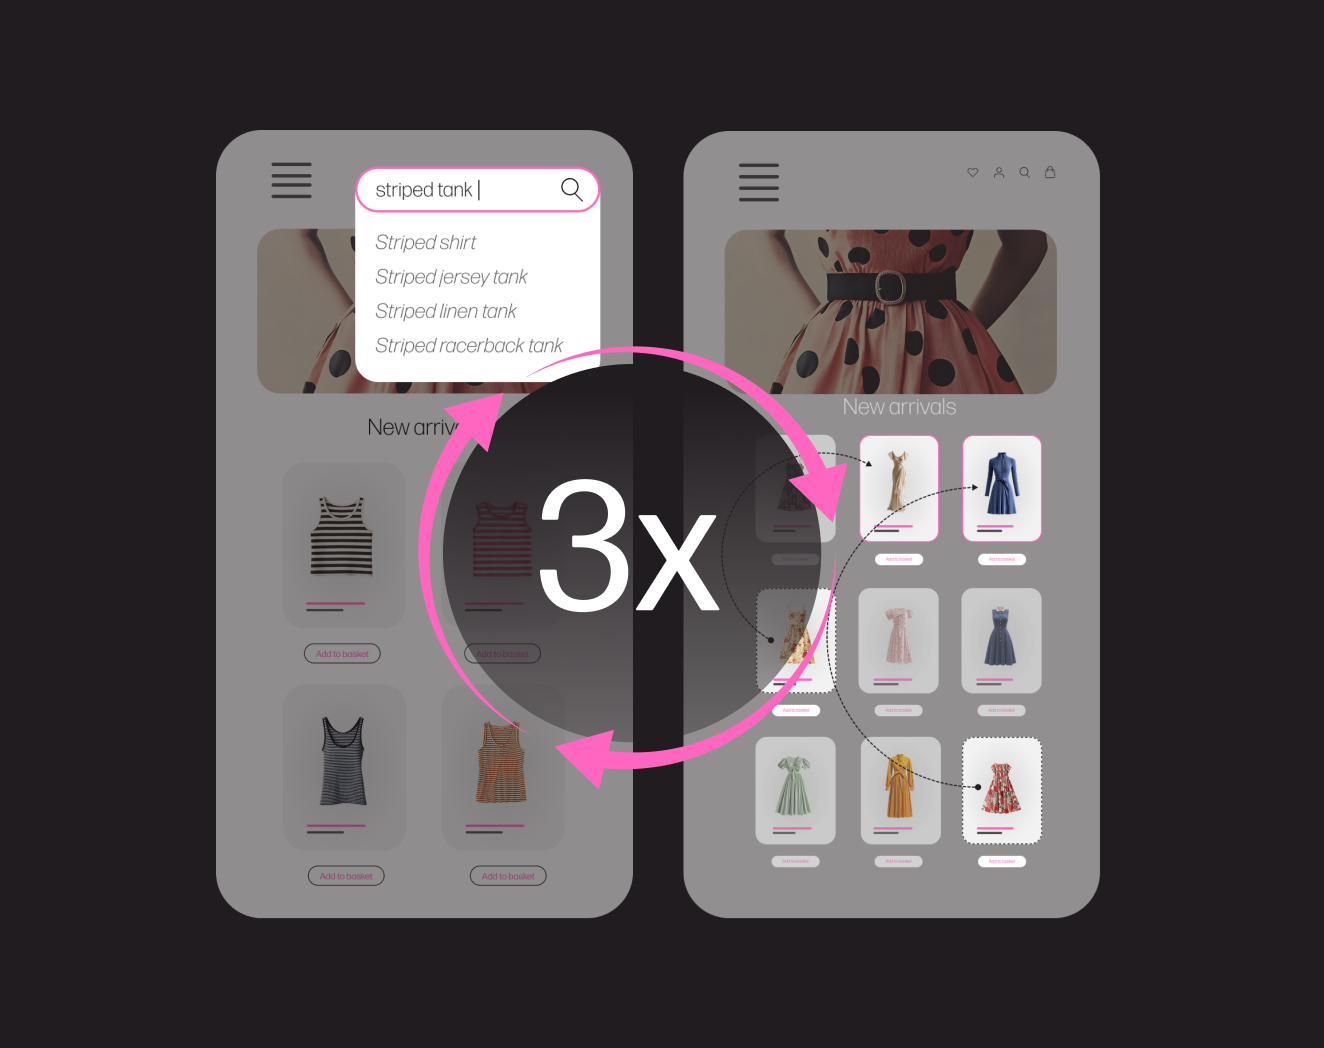
April 2, 2025 9 Minute Read Beyond the Basics: Advanced A/B Testing Strategies for Ecommerce Growth Read more
July 8, 2026 3 Minute Read Experiment beyond the storefront: new A/B testing levers driving ecommerce growth Read more
July 8, 2026 3 Minute Read Experiment beyond the storefront: new A/B testing levers driving ecommerce growth Read more
April 28, 2026 4 Minute Read Less managing, more selling: how AI is changing product bundling Read more
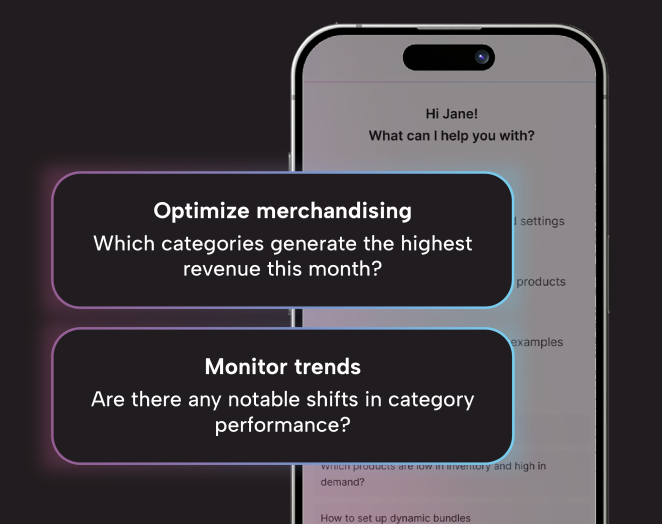
March 4, 2026 3 Minute Read Introducing the Data Analyst Agent: smarter, faster insights for commerce teams Read more
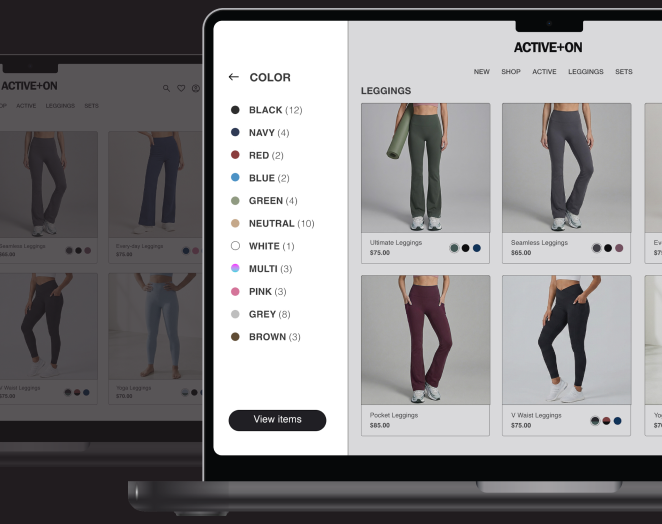
February 11, 2026 5 Minute Read Improving faceted navigation through faster, easier management Read more
October 9, 2025 4 Minute Read Nosto Announces Agentic Personalization Platform with Introduction of Huginn Read more
June 24, 2025 5 Minute Read Grow AOV & profit with Post-Purchase Upsell for Shopify checkout Read more
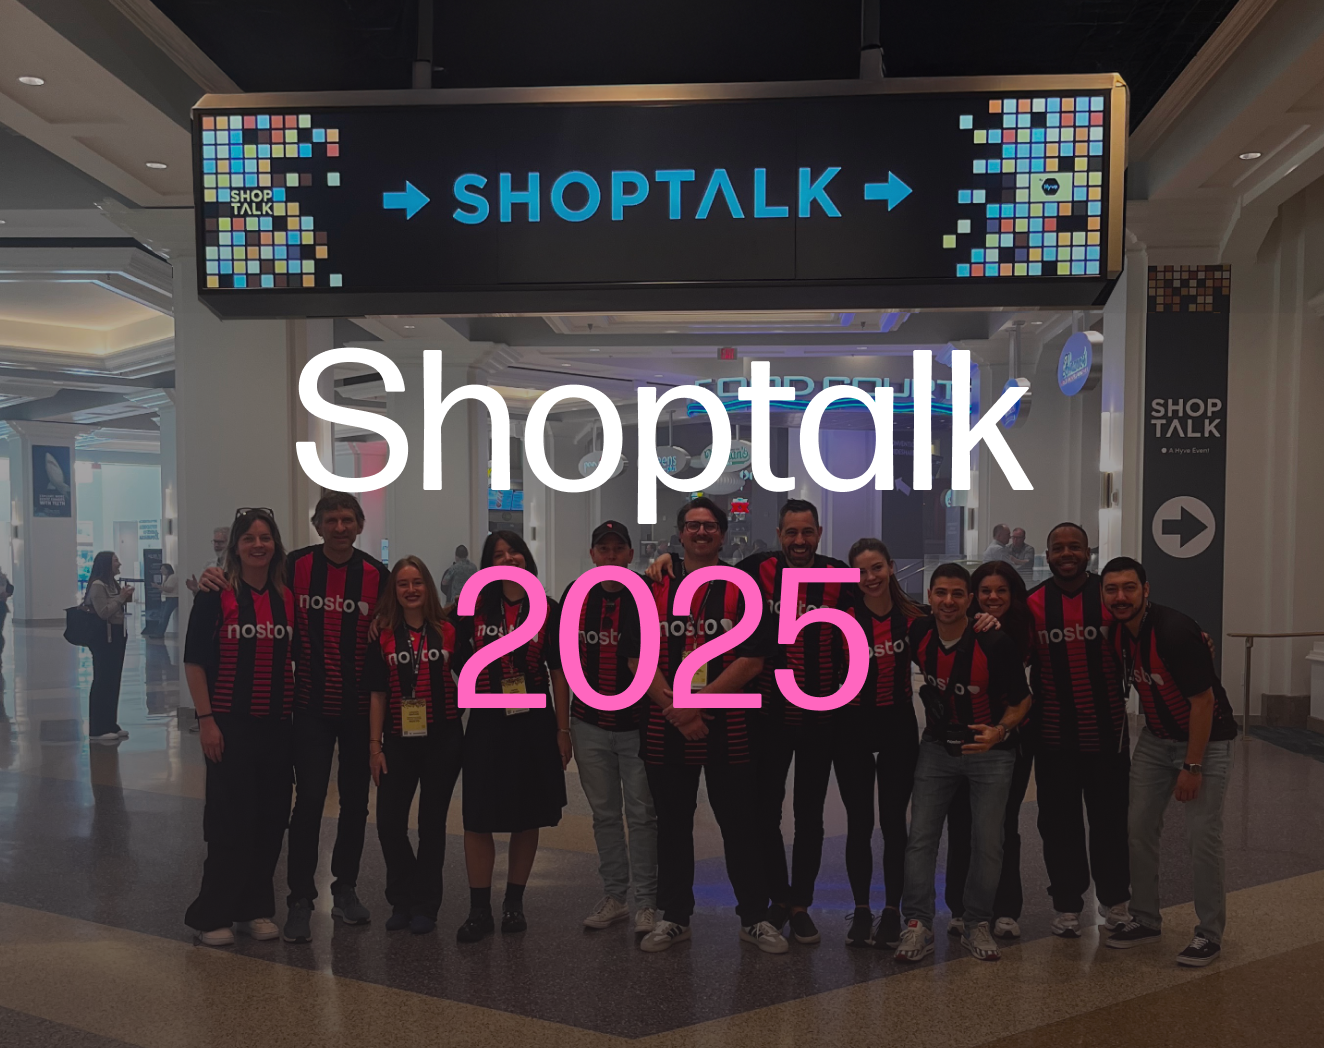
April 8, 2026 4 Minute Read The Shoptalk Cooldown: 4 Strategic Pillars for Your 2026 Growth Read more
April 7, 2026 2 Minute Read Guiding brands into the future with the Agentic Commerce Alliance Read more
March 4, 2026 5 Minute Read Nosto and Touchtech partner to bring personalized, connected shopping experiences across online and physical retail Read more
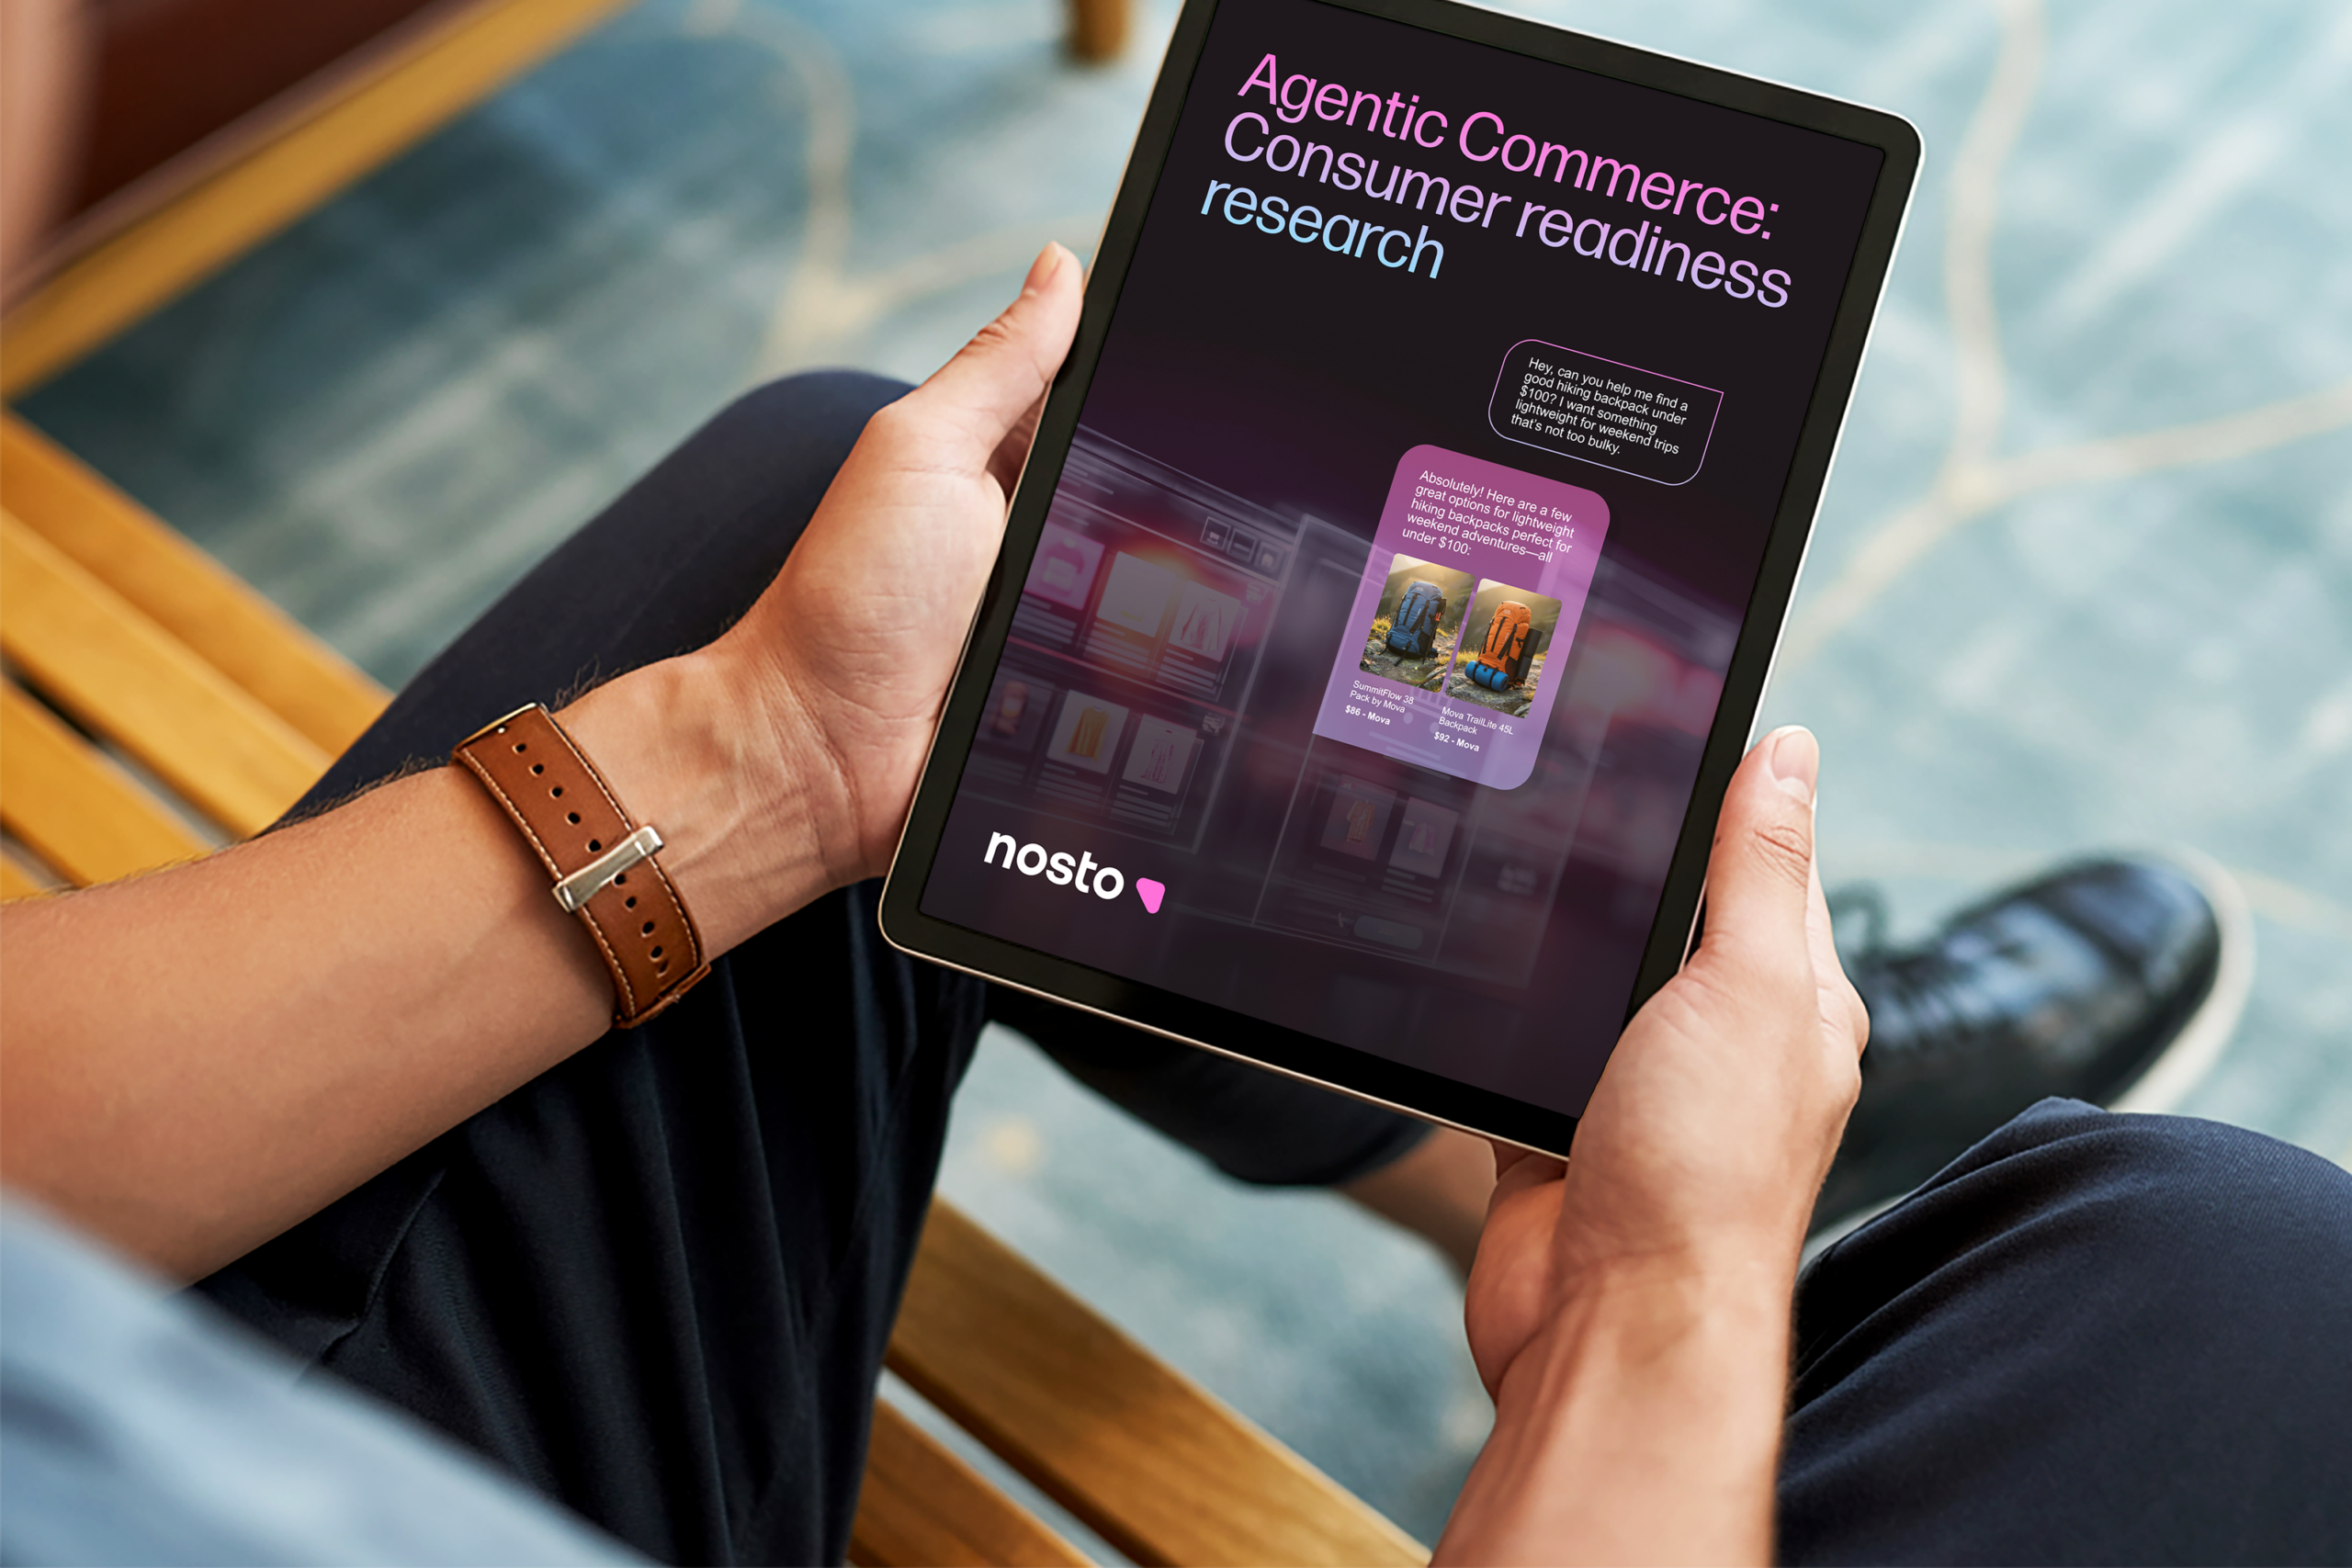
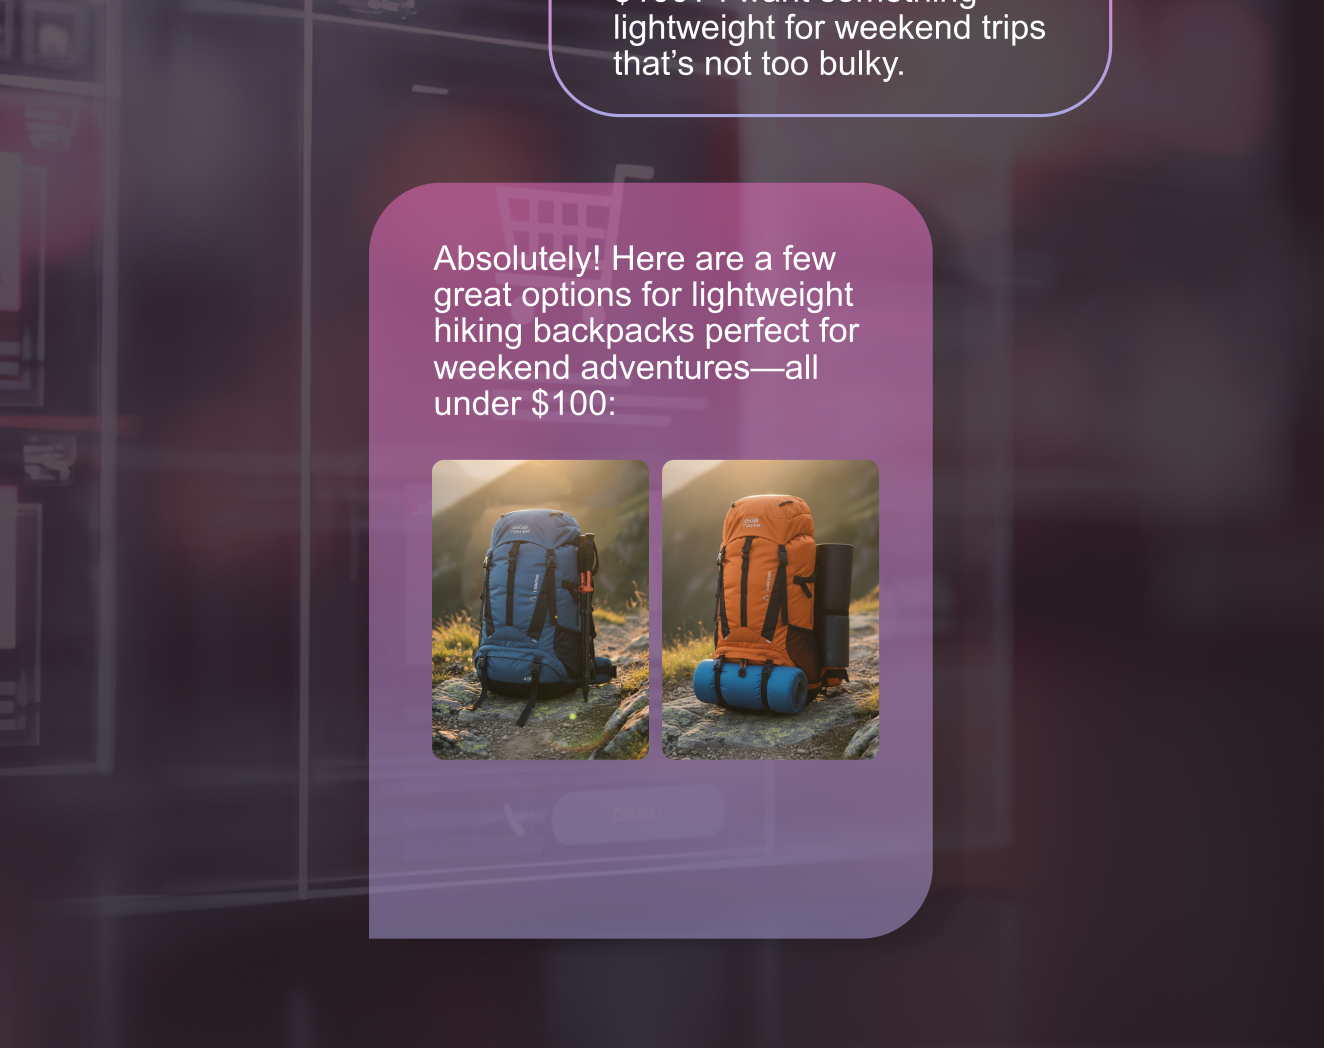
February 5, 2026 8 Minute Read Two-thirds of shoppers now open to using AI assistants to help them buy online Read more
October 9, 2025 4 Minute Read Nosto Announces Agentic Personalization Platform with Introduction of Huginn Read more
September 10, 2025 5 Minute Read 30% of Holiday Shoppers to Spend More if Their Chosen Presidential Candidate Wins, Research Reveals Read more
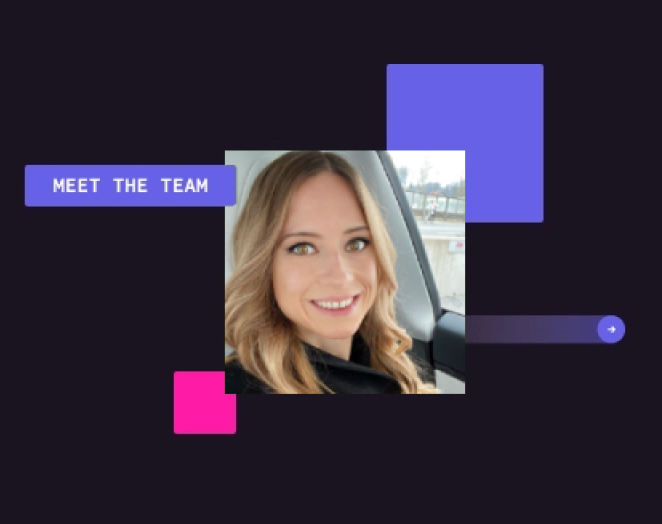
October 31, 2024 6 Minute Read Nosto’s Future of Work Policy: Providing flexible working options for all employees Read more
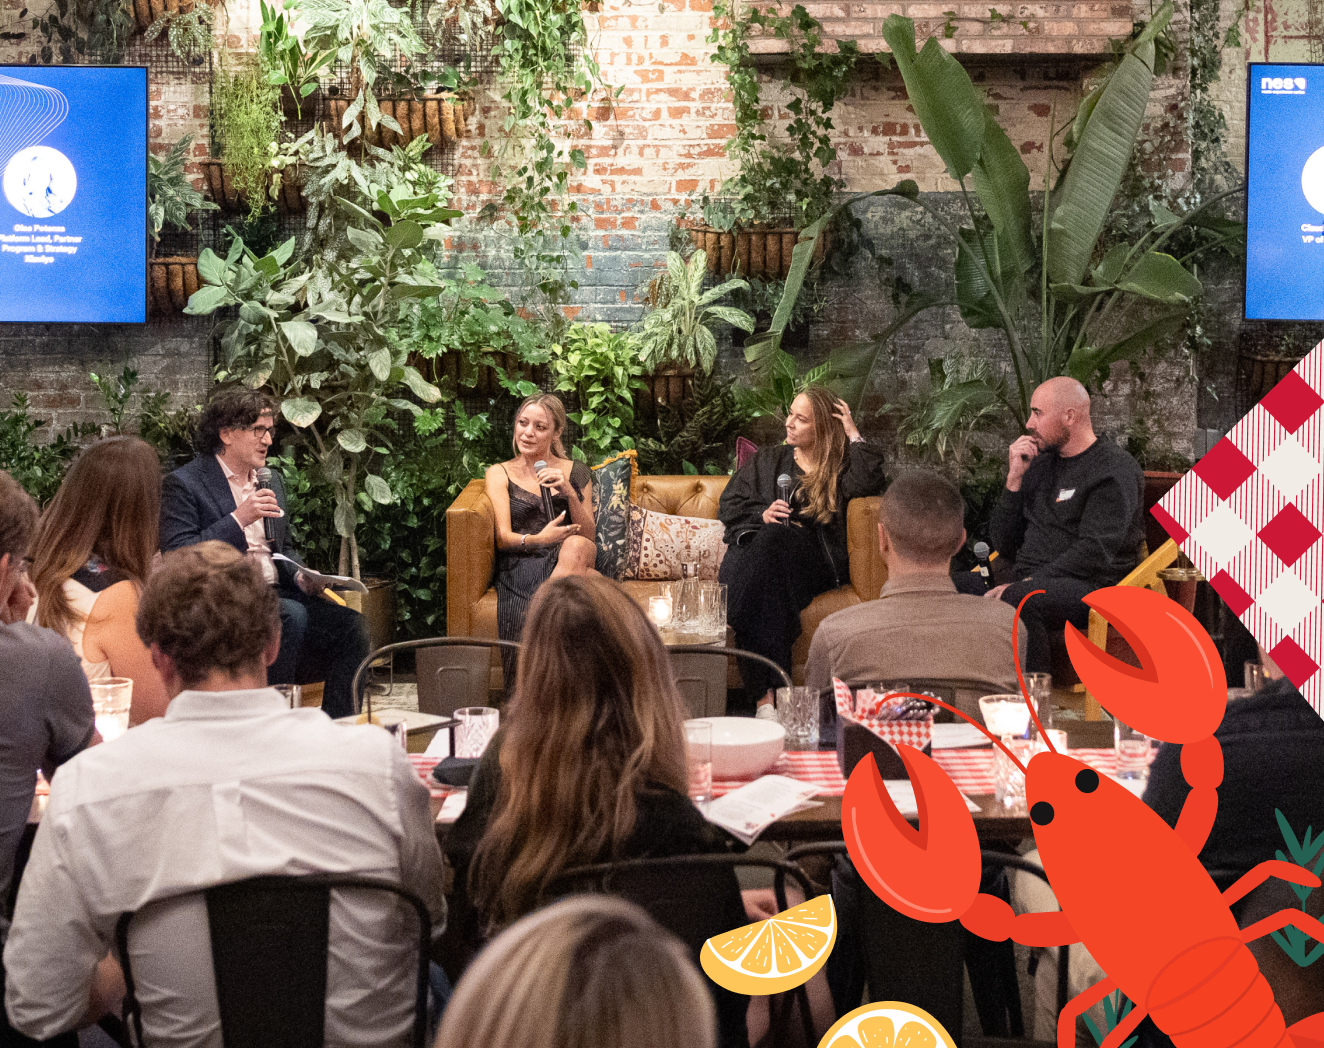
July 25, 2024 5 Minute Read Boosting Ecommerce Success: Key takeaways from NES Midsummer 2024 Read more
December 19, 2023 7 Minute Read Insights from ‘The Women’s Domain & The Rise of Social Commerce’ Panel Read more
October 19, 2023 8 Minute Read A look-back at Nosto’s Ecommerce Expo session: talking ‘intelligent product discovery’ with clients, Dermalogica, and Casio Read more
March 4, 2026 5 Minute Read Nosto and Touchtech partner to bring personalized, connected shopping experiences across online and physical retail Read more
September 18, 2025 2 Minute Read AI Personalization & Retention Plays to Win Q4 and build for 2025 with Credo Beauty and DVF Read more
June 3, 2024 11 Minute Read New research: How international ecommerce brands can combat hesitations of cross-border shoppers Read more
March 26, 2024 2 Minute Read Introducing the Nosto Customer Community: Elevating our Clients’ Experience with us Read more
April 7, 2022 6 Minute Read Consumer Behavior Stats 2021: The Post-Pandemic Shift in Online Shopping Habit Read more